WRITELOG is one of the common wait types found in the SQL Server. It is directly related to the speed and efficiency of writing transaction log stored in the file system. This ensures durability and data integrity. When WRITELOG waits are high, it usually indicates that SQL Server is spending too much time waiting for in-memory transaction log cache to be flushed to the transaction log file. This can slow down transactions and ripple across the entire workload. In this guide, we will explore what causes WRITELOG waits, how to identify the root bottlenecks, and practical ways to reduce their impact through configuration, hardware optimization, and workload tuning.

Figure-2: WRITELOG
WRITELOG
When there is a DUI (DELETE, UPDATE, or INSERT) operation, SQL Server does not store the data immediately to the transaction log file which is stored in the physical disk. First it stores the data temporarily in an in-memory structure called a Log cache/Log buffer. For ensuring ACID (Atomicity, Consistency, Isolation, and Durability) principle, it flushes the data from Log cache to the transaction log file. SQL Server starts counting the WRITELOG time when the Log cache starts to write the data to the transaction log file. So, WRITELOG time is the cumulation of this time for all the DUI operations across the SQL Server.
How Does WRITELOG Affect Performance
Excessive WRITELOG waits negatively impact on the SQL Server performance as it introduces delays in transaction processing. The performance impacts include:
- Slow performance - Transactions wait for the log to be written to disk for longer time which leads to overall slow performance.
- Reduced throughput - WRITELOG waits reduce the transactional throughput of the system, system with heavy write workloads become sluggish.
- Blocked processes - Processes waiting on transactions stuck in WRITELOG waits can lead to blocked queries, compounding the performance issues.
Some Common Causes and Resolutions
Disk Subsystem
WRITELOG is time taken to write the data from memory to disk system. So, a slower disk system means a higher WRITELOG time. Some recommendations for production SQL Server are:
- Use SSD disk for SQL Server with RAID 10.
- Place transaction log file (ldf) and data file (mdf) in separate physical disks. If they share the same physical disk but in separate drive, again there will be disk contention.
- Availability groups, Replication, mirroring or transaction log backup will out extra load on the disk IO and sometimes hard to mitigate. For example, if you are using availability groups, synchronous replication, WRITELOG may be hided within the HADR_SYNC_COMMIT wait. In synchronous replication, the primary replica will commit locally only after getting acknowledgement from the secondary. The HADR_SYNC_COMMIT wait is the time that the primary replica waits for this acknowledgement from the secondary and the WRITELOG wait represents the time it takes to write the log locally. These two time counts start at the same time. However, the HADR_SYNC_COMMIT wait usually will be longer than the WRITELOG. So, the WRITELOG wait often does not appear as a separate delay. For best practices, try to keep the IO within 5 milliseconds.
For details about identifying slower disk system and best practices for production level SQL Server, check my article.
Limitations of the Log Manager
SQL Server limits the number of log write operations that can be "in-flight" i.e. writes sent to disk but not yet confirmed. Once this limit is reached, the Log Manager pauses new writes until the acknowledge of current one. These are hard limits (outstanding log I/O and Outstanding I/O limit) set by SQL Server and you cannot change it. This ensures balance between data integrity and performance.
System Design
Sometimes the issue is not the disk. It is your application design and how it passes queries to the SQL Server. Let's examine it.
-- Creating a new table
IF OBJECT_ID(N'dbo.[Table1]', N'U') IS NOT NULL
   DROP TABLE [dbo].[Table1];
GO

CREATE TABLE [dbo].[Table1](
	[id] [int] IDENTITY(1,1) NOT NULL,
	[name] [varchar](50) NULL,
 CONSTRAINT [PK_Table1] PRIMARY KEY CLUSTERED
(
	[id] ASC
) ON [PRIMARY]
) ON [PRIMARY]
GO

Query Snippet-1
Create a test table using the above Query Snippet-1. Now clear the older wait stats. Be careful to use the Query Snippet-2 in the production which will clear the LIVE wait stats.
-- Clear the wait stat. Be careful to execute it in your production server.
DBCC SQLPERF ('sys.dm_os_wait_stats', CLEAR);
GO

Query Snippet-2
Open a separate query window and paste and execute Query Snippet-3.
-- Implicit transaction

SET NOCOUNT ON
DECLARE @i INT
SET @i = 1

WHILE @i < 10000
BEGIN
	INSERT INTO Table1([name])
	VALUES ('MEHEDI - ' + CAST (@i as VARCHAR))
    SET @i = @i + 1
END

Query Snippet-3
You can check the wait stat data related to WRITELOG using below Query Snippet-4. In my test environment, it took around 60 sec to execute the Query Snippet-3 and wait time is quite high as shown in the figure-2.
SELECT COUNT(*) FROM Table1
GO
-- Check WRITELOG wait stat
SELECT wait_type, wait_time_ms, signal_wait_time_ms, waiting_tasks_count
FROM sys.dm_os_wait_stats
WHERE wait_type = 'WRITELOG'
GO

Query Snippet-4

Figure-2: Wait stats of WRITELOG for implicit transaction of Query Snippet-3.
Now clear the wait stat using Query Snippet-2, run the Query Snippet-5 and monitor it using Query Snippet-4. This time, the Query Snippet-5 executed within 2 sec and check the WRITELOG wait stat. Compare the two results. There is huge difference between Firgure-2 & 3. It shows that explicit transaction is far better then implicit transaction.
-- Explicit transaction
SET NOCOUNT ON
DECLARE @i INT
SET @i = 1

BEGIN TRAN
WHILE @i < 10000
BEGIN
	INSERT INTO Table1([name])
	VALUES ('MEHEDI - ' + CAST (@i as VARCHAR))
    SET @i = @i + 1
END
COMMIT

Query Snippet-5
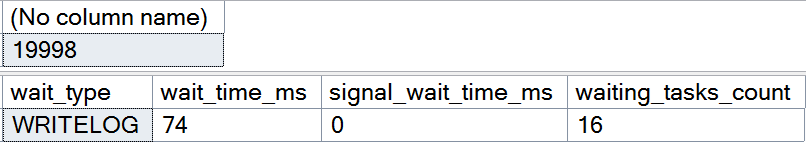
Figure-3: Wait stats of WRITELOG for explicit transaction of Query Snippet-3.
Why does the performance differ in above two similar queries?
The answer lies in the internal architecture of SQL Server. The Query Snippet-3 is an implicit transaction as transaction begins as soon as the insert statement starts and it commits when the statement finishes. So for this query SQL Server flashes buffer log 9,999 times. Where as the Query Snippet-5 is an explicit transaction as there is BEGIN TRAN ... COMMIT command and this also makes it an atomic transaction. So for the later case, SQL Server flashes buffer log when either buffer log is full or the transaction is committed.
This experiment shows:
- All WRITELOG wait type does not related to the disk system. Though disk has significant impact on WRITELOG wait type. Evaluate how queries are dispatching from application also.
- Try to find out and optimize the implicit transactions transactions if possible.
- If possible club the single INSERT/UPDATE/DELETE transaction into batch.
Final Words
WRITELOG waits signal that your transaction log subsystem might be under pressure. Understanding their root causes will help you to take the corrective action accordingly. Remember that you cannot eliminate it entirely. Your objective will be maintaining a healthy and responsive SQL Server that can handle every transaction.
References
Going Further
If SQL Server is your thing and you enjoy learning real-world tips, tricks, and performance hacks—you are going to love my training sessions too!
Need results fast? I am also available for 1-on-1 consultancy to help you troubleshoot and fix your database performance issues.
Let’s make your SQL Server to take your business Challenge!
For any queries, mail to mamehedi.hasan[at]gmail.com.