In part-1, we explored the basics of SQL Server Wait Statistics—what they are, how they work, and how to gauge. Now it is time to put that knowledge into action. In this part, you are going to use wait stats as a powerful tool to diagnose performance bottlenecks and guide your tuning efforts.
Think of wait stats as your server’s way of telling you where it is struggling—whether it is waiting on disk I/O, locking issues, or just CPU pressure. By learning to read these signals, you will be able to focus your optimization efforts where they matter most and keep your SQL Server running smoothly.
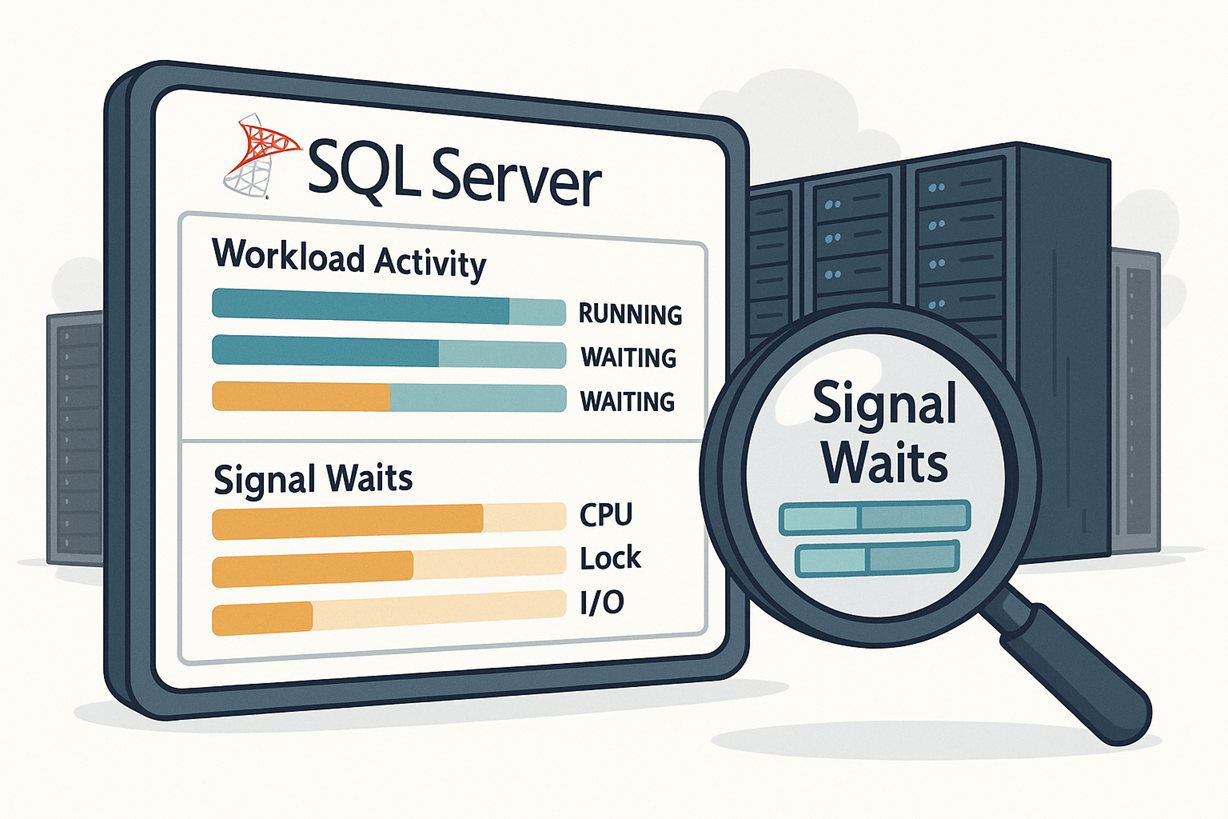
Figure-1: Performance Tuning using SQL Server Wait Statistics
Performance Tuning using Wait Statistics
As we discussed in part-1, when you submit a query to SQL Server, the query will either executing on the CPU, waiting for a resource (resource wait) or waiting for a turn on the CPU (signal wait). In other words,
The Response time = service time + total wait time = service time + resource wait time + signal wait time
So, the main comprising components of the response time can indicate the top pain points of SQL Server. However, when using wait statistics for performance tuning, keep two key points in mind:
- Not all waits are bad – It is completely normal for threads to wait in a busy SQL Server. Some waits are harmless and expected. Focus on waits that are frequent and cause noticeable slowdowns.
- Do not rely on wait stats alone – Wait statistics work best when combined with other tools like Performance Monitor (PerfMon). Together, they help you pinpoint the real resource bottlenecks and avoid wasting time on false leads.
Finding out Active but Blocked Queries
You can check the current, "real time" wait info of your server using the sys.dm_os_waiting_tasks DMV and joining it with other useful views and functions like sys.dm_exec_connections, sys.dm_exec_requests and sys.dm_exec_sql_text. Remember that many wait types in SQL Server are short-lived. They come and go very quickly. So, if you check the sys.dm_os_waiting_tasks view on a healthy system, you will often see a constantly changing list of wait types. However, this view becomes really useful when the server is experiencing blocking issues — where some sessions are stuck waiting for resources that other sessions are using. In such cases, you will often see LCK_M_XX waits, which means a session is waiting for a lock to be released by another session. Common reasons for this kind of blocking are:
- Inefficient queries that hold locks too long
- Missing indexes, or
- Heavy I/O operations that slow everything down.
If your server often has blocking problems, you will also see these lock-related waits in sys.dm_os_wait_stats.
SELECT blocking.session_id AS blocking_session_id ,
blocked.session_id AS blocked_session_id ,
waitstats.wait_type AS blocking_resource ,
waitstats.wait_duration_ms ,
waitstats.resource_description ,
blocked_cache.text AS blocked_text ,
blocking_cache.text AS blocking_text
FROM sys.dm_exec_connections AS blocking
INNER JOIN sys.dm_exec_requests blocked
ON blocking.session_id = blocked.blocking_session_id
CROSS APPLY sys.dm_exec_sql_text(blocked.sql_handle) blocked_cache
CROSS APPLY sys.dm_exec_sql_text(blocking.most_recent_sql_handle) blocking_cache
INNER JOIN sys.dm_os_waiting_tasks waitstats
ON waitstats.session_id = blocked.session_id
The above query shows all waiting tasks currently active or blocked. It displays the wait type, duration, resource, the identity of the blocked and blocking sessions and the associated statements.
Remarkable Columns of sys.dm_os_waiting_tasks
- session_id - suspended thread's session id
- exec_context_id - suspended thread's execution context id. If there is more than one execution context id in a single session id, then SQL Server has parallelized the task.
- wait_type - suspended thread's wait type
- wait_duration_ms - how long the suspended thread is waiting for the current wait type
- blocking_session_id - blocking thread's session id.
- resource_description - description of the resource the suspended thread is waiting to acquire
Analyzing Historical Wait Statistics
sys.dm_os_wait_stats provides cumulative historical wait statistics of all threads and sessions since the server was last
restarted or the statistics were manually reset. If a SQL Server is running for quite long and recently there is performance issue, it is better to clear the old wait statistics. Otherwise, it will supersede the present wait stat. Below query will clear the wait statistics:
DBCC SQLPERF ('sys.dm_os_wait_stats', CLEAR);
Remarkable Columns of sys.dm_os_wait_stats
- wait_type – the resource for which the worked threads waited
- waiting_tasks_count – the cumulative total number of waits that have occurred for the associated resource (wait_type)
- wait_time_ms – aggregated amount of wait time
- max_wait_time_ms – the maximum amount of time that a thread has been delayed, for a wait of this type.
- signal_wait_time_ms – cumulative amount of time threads spent in the runnable queue
Find out CPU Pressure
If the signal wait time is a big part of the total wait time, it indicates CPU pressure. This usually happens for two reasons:
- There are too many heavy queries using up the CPU — they need to be optimized.
- Or, your server simply doesn’t have enough CPU power for the workload — maybe it needs an upgrade.
Below query will display the total signal wait time and percentage signal wait time of total time.
SELECT SUM(signal_wait_time_ms) AS TotalSignalWaitTime,( SUM(CAST(signal_wait_time_ms AS NUMERIC(20, 2)))/ SUM(CAST(wait_time_ms AS NUMERIC(20, 2))) * 100 ) AS PercentageSignalWaitsOfTotalTime
FROM sys.dm_os_wait_stats
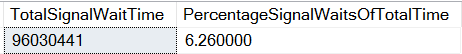
Figure-2: CPU Pressure
Validate CPU Pressure
If your signal wait analysis shows signs of CPU pressure (meaning tasks are waiting too long just to get CPU time), you can use a special DMV called sys.dm_os_schedulers to double-check if your SQL Server is CPU-bound. This view shows details for each SQL Server scheduler (think of schedulers like managers that assign work to CPUs). It tells you:
- How many total tasks are assigned.
- How many of those tasks are runnable (i.e., ready and waiting to use the CPU).
If the number of runnable tasks is high for each scheduler, it usually means there's CPU pressure — many tasks are ready but waiting for CPU time. The rest of the tasks that aren't in the runnable list are either sleeping (idle) or waiting for a resource (like a lock or disk I/O).
SELECT scheduler_id ,
current_tasks_count ,
runnable_tasks_count
FROM sys.dm_os_schedulers
WHERE scheduler_id < 255
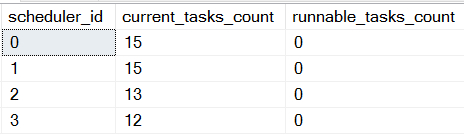
Figure-3: Validate CPU Pressure by Querying Scheduler Queues
Find out the Primary Resource waits
The following query will help you to reveal the top bottlenecks of your SQL Server. This is written by one of my favorite SQL guru
Paul Randal. There are help url for every wait type which will help you to investigate it further.
-- Last updated October 1, 2021
WITH [Waits] AS
    (SELECT
        [wait_type],
        [wait_time_ms] / 1000.0 AS [WaitS],
        ([wait_time_ms] - [signal_wait_time_ms]) / 1000.0 AS [ResourceS],
        [signal_wait_time_ms] / 1000.0 AS [SignalS],
        [waiting_tasks_count] AS [WaitCount],
        100.0 * [wait_time_ms] / SUM ([wait_time_ms]) OVER() AS [Percentage],
        ROW_NUMBER() OVER(ORDER BY [wait_time_ms] DESC) AS [RowNum]
    FROM sys.dm_os_wait_stats
    WHERE [wait_type] NOT IN (
        -- These wait types are almost 100% never a problem and so they are
        -- filtered out to avoid them skewing the results. Click on the URL
        -- for more information.
        N'BROKER_EVENTHANDLER', -- https://www.sqlskills.com/help/waits/BROKER_EVENTHANDLER
        N'BROKER_RECEIVE_WAITFOR', -- https://www.sqlskills.com/help/waits/BROKER_RECEIVE_WAITFOR
        N'BROKER_TASK_STOP', -- https://www.sqlskills.com/help/waits/BROKER_TASK_STOP
        N'BROKER_TO_FLUSH', -- https://www.sqlskills.com/help/waits/BROKER_TO_FLUSH
        N'BROKER_TRANSMITTER', -- https://www.sqlskills.com/help/waits/BROKER_TRANSMITTER
        N'CHECKPOINT_QUEUE', -- https://www.sqlskills.com/help/waits/CHECKPOINT_QUEUE
        N'CHKPT', -- https://www.sqlskills.com/help/waits/CHKPT
        N'CLR_AUTO_EVENT', -- https://www.sqlskills.com/help/waits/CLR_AUTO_EVENT
        N'CLR_MANUAL_EVENT', -- https://www.sqlskills.com/help/waits/CLR_MANUAL_EVENT
        N'CLR_SEMAPHORE', -- https://www.sqlskills.com/help/waits/CLR_SEMAPHORE

        -- Maybe comment this out if you have parallelism issues
        N'CXCONSUMER', -- https://www.sqlskills.com/help/waits/CXCONSUMER

        -- Maybe comment these four out if you have mirroring issues
        N'DBMIRROR_DBM_EVENT', -- https://www.sqlskills.com/help/waits/DBMIRROR_DBM_EVENT
        N'DBMIRROR_EVENTS_QUEUE', -- https://www.sqlskills.com/help/waits/DBMIRROR_EVENTS_QUEUE
        N'DBMIRROR_WORKER_QUEUE', -- https://www.sqlskills.com/help/waits/DBMIRROR_WORKER_QUEUE
        N'DBMIRRORING_CMD', -- https://www.sqlskills.com/help/waits/DBMIRRORING_CMD
        N'DIRTY_PAGE_POLL', -- https://www.sqlskills.com/help/waits/DIRTY_PAGE_POLL
        N'DISPATCHER_QUEUE_SEMAPHORE', -- https://www.sqlskills.com/help/waits/DISPATCHER_QUEUE_SEMAPHORE
        N'EXECSYNC', -- https://www.sqlskills.com/help/waits/EXECSYNC
        N'FSAGENT', -- https://www.sqlskills.com/help/waits/FSAGENT
        N'FT_IFTS_SCHEDULER_IDLE_WAIT', -- https://www.sqlskills.com/help/waits/FT_IFTS_SCHEDULER_IDLE_WAIT
        N'FT_IFTSHC_MUTEX', -- https://www.sqlskills.com/help/waits/FT_IFTSHC_MUTEX

       -- Maybe comment these six out if you have AG issues
        N'HADR_CLUSAPI_CALL', -- https://www.sqlskills.com/help/waits/HADR_CLUSAPI_CALL
        N'HADR_FILESTREAM_IOMGR_IOCOMPLETION', -- https://www.sqlskills.com/help/waits/HADR_FILESTREAM_IOMGR_IOCOMPLETION
        N'HADR_LOGCAPTURE_WAIT', -- https://www.sqlskills.com/help/waits/HADR_LOGCAPTURE_WAIT
        N'HADR_NOTIFICATION_DEQUEUE', -- https://www.sqlskills.com/help/waits/HADR_NOTIFICATION_DEQUEUE
        N'HADR_TIMER_TASK', -- https://www.sqlskills.com/help/waits/HADR_TIMER_TASK
        N'HADR_WORK_QUEUE', -- https://www.sqlskills.com/help/waits/HADR_WORK_QUEUE

        N'KSOURCE_WAKEUP', -- https://www.sqlskills.com/help/waits/KSOURCE_WAKEUP
        N'LAZYWRITER_SLEEP', -- https://www.sqlskills.com/help/waits/LAZYWRITER_SLEEP
        N'LOGMGR_QUEUE', -- https://www.sqlskills.com/help/waits/LOGMGR_QUEUE
        N'MEMORY_ALLOCATION_EXT', -- https://www.sqlskills.com/help/waits/MEMORY_ALLOCATION_EXT
        N'ONDEMAND_TASK_QUEUE', -- https://www.sqlskills.com/help/waits/ONDEMAND_TASK_QUEUE
        N'PARALLEL_REDO_DRAIN_WORKER', -- https://www.sqlskills.com/help/waits/PARALLEL_REDO_DRAIN_WORKER
        N'PARALLEL_REDO_LOG_CACHE', -- https://www.sqlskills.com/help/waits/PARALLEL_REDO_LOG_CACHE
        N'PARALLEL_REDO_TRAN_LIST', -- https://www.sqlskills.com/help/waits/PARALLEL_REDO_TRAN_LIST
        N'PARALLEL_REDO_WORKER_SYNC', -- https://www.sqlskills.com/help/waits/PARALLEL_REDO_WORKER_SYNC
        N'PARALLEL_REDO_WORKER_WAIT_WORK', -- https://www.sqlskills.com/help/waits/PARALLEL_REDO_WORKER_WAIT_WORK
        N'PREEMPTIVE_OS_FLUSHFILEBUFFERS', -- https://www.sqlskills.com/help/waits/PREEMPTIVE_OS_FLUSHFILEBUFFERS
        N'PREEMPTIVE_XE_GETTARGETSTATE', -- https://www.sqlskills.com/help/waits/PREEMPTIVE_XE_GETTARGETSTATE
        N'PVS_PREALLOCATE', -- https://www.sqlskills.com/help/waits/PVS_PREALLOCATE
        N'PWAIT_ALL_COMPONENTS_INITIALIZED', -- https://www.sqlskills.com/help/waits/PWAIT_ALL_COMPONENTS_INITIALIZED
        N'PWAIT_DIRECTLOGCONSUMER_GETNEXT', -- https://www.sqlskills.com/help/waits/PWAIT_DIRECTLOGCONSUMER_GETNEXT
        N'PWAIT_EXTENSIBILITY_CLEANUP_TASK', -- https://www.sqlskills.com/help/waits/PWAIT_EXTENSIBILITY_CLEANUP_TASK
        N'QDS_PERSIST_TASK_MAIN_LOOP_SLEEP', -- https://www.sqlskills.com/help/waits/QDS_PERSIST_TASK_MAIN_LOOP_SLEEP
        N'QDS_ASYNC_QUEUE', -- https://www.sqlskills.com/help/waits/QDS_ASYNC_QUEUE
        N'QDS_CLEANUP_STALE_QUERIES_TASK_MAIN_LOOP_SLEEP',
            -- https://www.sqlskills.com/help/waits/QDS_CLEANUP_STALE_QUERIES_TASK_MAIN_LOOP_SLEEP
        N'QDS_SHUTDOWN_QUEUE', -- https://www.sqlskills.com/help/waits/QDS_SHUTDOWN_QUEUE
        N'REDO_THREAD_PENDING_WORK', -- https://www.sqlskills.com/help/waits/REDO_THREAD_PENDING_WORK
        N'REQUEST_FOR_DEADLOCK_SEARCH', -- https://www.sqlskills.com/help/waits/REQUEST_FOR_DEADLOCK_SEARCH
        N'RESOURCE_QUEUE', -- https://www.sqlskills.com/help/waits/RESOURCE_QUEUE
        N'SERVER_IDLE_CHECK', -- https://www.sqlskills.com/help/waits/SERVER_IDLE_CHECK
        N'SLEEP_BPOOL_FLUSH', -- https://www.sqlskills.com/help/waits/SLEEP_BPOOL_FLUSH
        N'SLEEP_DBSTARTUP', -- https://www.sqlskills.com/help/waits/SLEEP_DBSTARTUP
        N'SLEEP_DCOMSTARTUP', -- https://www.sqlskills.com/help/waits/SLEEP_DCOMSTARTUP
        N'SLEEP_MASTERDBREADY', -- https://www.sqlskills.com/help/waits/SLEEP_MASTERDBREADY
        N'SLEEP_MASTERMDREADY', -- https://www.sqlskills.com/help/waits/SLEEP_MASTERMDREADY
        N'SLEEP_MASTERUPGRADED', -- https://www.sqlskills.com/help/waits/SLEEP_MASTERUPGRADED
        N'SLEEP_MSDBSTARTUP', -- https://www.sqlskills.com/help/waits/SLEEP_MSDBSTARTUP
        N'SLEEP_SYSTEMTASK', -- https://www.sqlskills.com/help/waits/SLEEP_SYSTEMTASK
        N'SLEEP_TASK', -- https://www.sqlskills.com/help/waits/SLEEP_TASK
        N'SLEEP_TEMPDBSTARTUP', -- https://www.sqlskills.com/help/waits/SLEEP_TEMPDBSTARTUP
        N'SNI_HTTP_ACCEPT', -- https://www.sqlskills.com/help/waits/SNI_HTTP_ACCEPT
        N'SOS_WORK_DISPATCHER', -- https://www.sqlskills.com/help/waits/SOS_WORK_DISPATCHER
        N'SP_SERVER_DIAGNOSTICS_SLEEP', -- https://www.sqlskills.com/help/waits/SP_SERVER_DIAGNOSTICS_SLEEP
        N'SQLTRACE_BUFFER_FLUSH', -- https://www.sqlskills.com/help/waits/SQLTRACE_BUFFER_FLUSH
        N'SQLTRACE_INCREMENTAL_FLUSH_SLEEP', -- https://www.sqlskills.com/help/waits/SQLTRACE_INCREMENTAL_FLUSH_SLEEP
        N'SQLTRACE_WAIT_ENTRIES', -- https://www.sqlskills.com/help/waits/SQLTRACE_WAIT_ENTRIES
        N'VDI_CLIENT_OTHER', -- https://www.sqlskills.com/help/waits/VDI_CLIENT_OTHER
        N'WAIT_FOR_RESULTS', -- https://www.sqlskills.com/help/waits/WAIT_FOR_RESULTS
        N'WAITFOR', -- https://www.sqlskills.com/help/waits/WAITFOR
        N'WAITFOR_TASKSHUTDOWN', -- https://www.sqlskills.com/help/waits/WAITFOR_TASKSHUTDOWN
        N'WAIT_XTP_RECOVERY', -- https://www.sqlskills.com/help/waits/WAIT_XTP_RECOVERY
        N'WAIT_XTP_HOST_WAIT', -- https://www.sqlskills.com/help/waits/WAIT_XTP_HOST_WAIT
        N'WAIT_XTP_OFFLINE_CKPT_NEW_LOG', -- https://www.sqlskills.com/help/waits/WAIT_XTP_OFFLINE_CKPT_NEW_LOG
        N'WAIT_XTP_CKPT_CLOSE', -- https://www.sqlskills.com/help/waits/WAIT_XTP_CKPT_CLOSE
        N'XE_DISPATCHER_JOIN', -- https://www.sqlskills.com/help/waits/XE_DISPATCHER_JOIN
        N'XE_DISPATCHER_WAIT', -- https://www.sqlskills.com/help/waits/XE_DISPATCHER_WAIT
        N'XE_TIMER_EVENT' -- https://www.sqlskills.com/help/waits/XE_TIMER_EVENT
        )
    AND [waiting_tasks_count] > 0
    )
SELECT
    MAX ([W1].[wait_type]) AS [WaitType],
    CAST (MAX ([W1].[WaitS]) AS DECIMAL (16,2)) AS [Wait_S],
    CAST (MAX ([W1].[ResourceS]) AS DECIMAL (16,2)) AS [Resource_S],
    CAST (MAX ([W1].[SignalS]) AS DECIMAL (16,2)) AS [Signal_S],
    MAX ([W1].[WaitCount]) AS [WaitCount],
    CAST (MAX ([W1].[Percentage]) AS DECIMAL (5,2)) AS [Percentage],
    CAST ((MAX ([W1].[WaitS]) / MAX ([W1].[WaitCount])) AS DECIMAL (16,4)) AS [AvgWait_S],
    CAST ((MAX ([W1].[ResourceS]) / MAX ([W1].[WaitCount])) AS DECIMAL (16,4)) AS [AvgRes_S],
    CAST ((MAX ([W1].[SignalS]) / MAX ([W1].[WaitCount])) AS DECIMAL (16,4)) AS [AvgSig_S],
    CAST ('https://www.sqlskills.com/help/waits/' + MAX ([W1].[wait_type]) as XML) AS [Help/Info URL]
FROM [Waits] AS [W1]
INNER JOIN [Waits] AS [W2] ON [W2].[RowNum] <= [W1].[RowNum]
GROUP BY [W1].[RowNum]
HAVING SUM ([W2].[Percentage]) - MAX( [W1].[Percentage] ) < 95; -- percentage threshold
GO
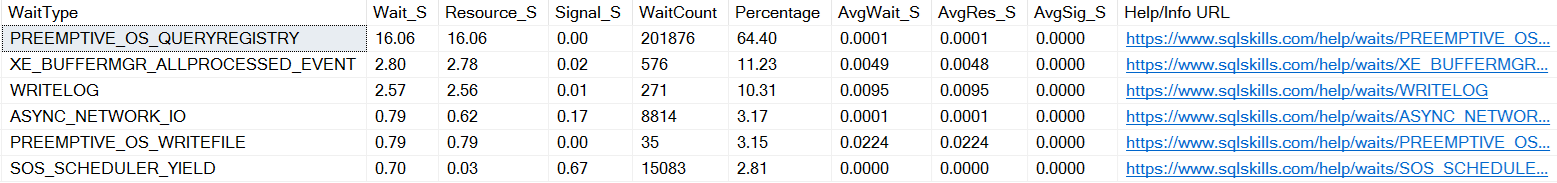
Figure-4: Primary Resources Wait
The main purpose of sys.dm_os_wait_stats is to help you understand where SQL Server is spending most of its waiting time while handling workloads. It shows which wait types and resources have caused the most delays over time. But when analyzing this data, it's important to:
- Focus on the most common and impactful waits, and
- Ignore harmless (benign) waits that happen all the time and usually do not cause performance problems. Paul Randal already filtered these wait types in above query.
This helps you spot the real issues and avoid being distracted by normal system behavior.
Final Words
In this part, we have examined how to use different DMVs to diagonise SQL Server performance issue and what should keep in mind in this investigation process. In next and final part, you will see the diagnosis of common wait types and how to baseline wait stat of your server.
Going Further
If SQL Server is your thing and you enjoy learning real-world tips, tricks, and performance hacks—you are going to love my training sessions too!
Need results fast? I am also available for 1-on-1 consultancy to help you troubleshoot and fix your database performance issues.
Let’s make your SQL Server to take your business Challenge!
For any queries, mail to mamehedi.hasan[at]gmail.com.