In Part-1 we discussed, about the basic concepts of wait stat and in Part-2 we checked how to find out blocked queries, analysis of historical data, CPU pressure and primary resource waits. In this final part, you will see the troubleshooting of common wait types, and check how to create baseline for wait stat. Let's deep drive!
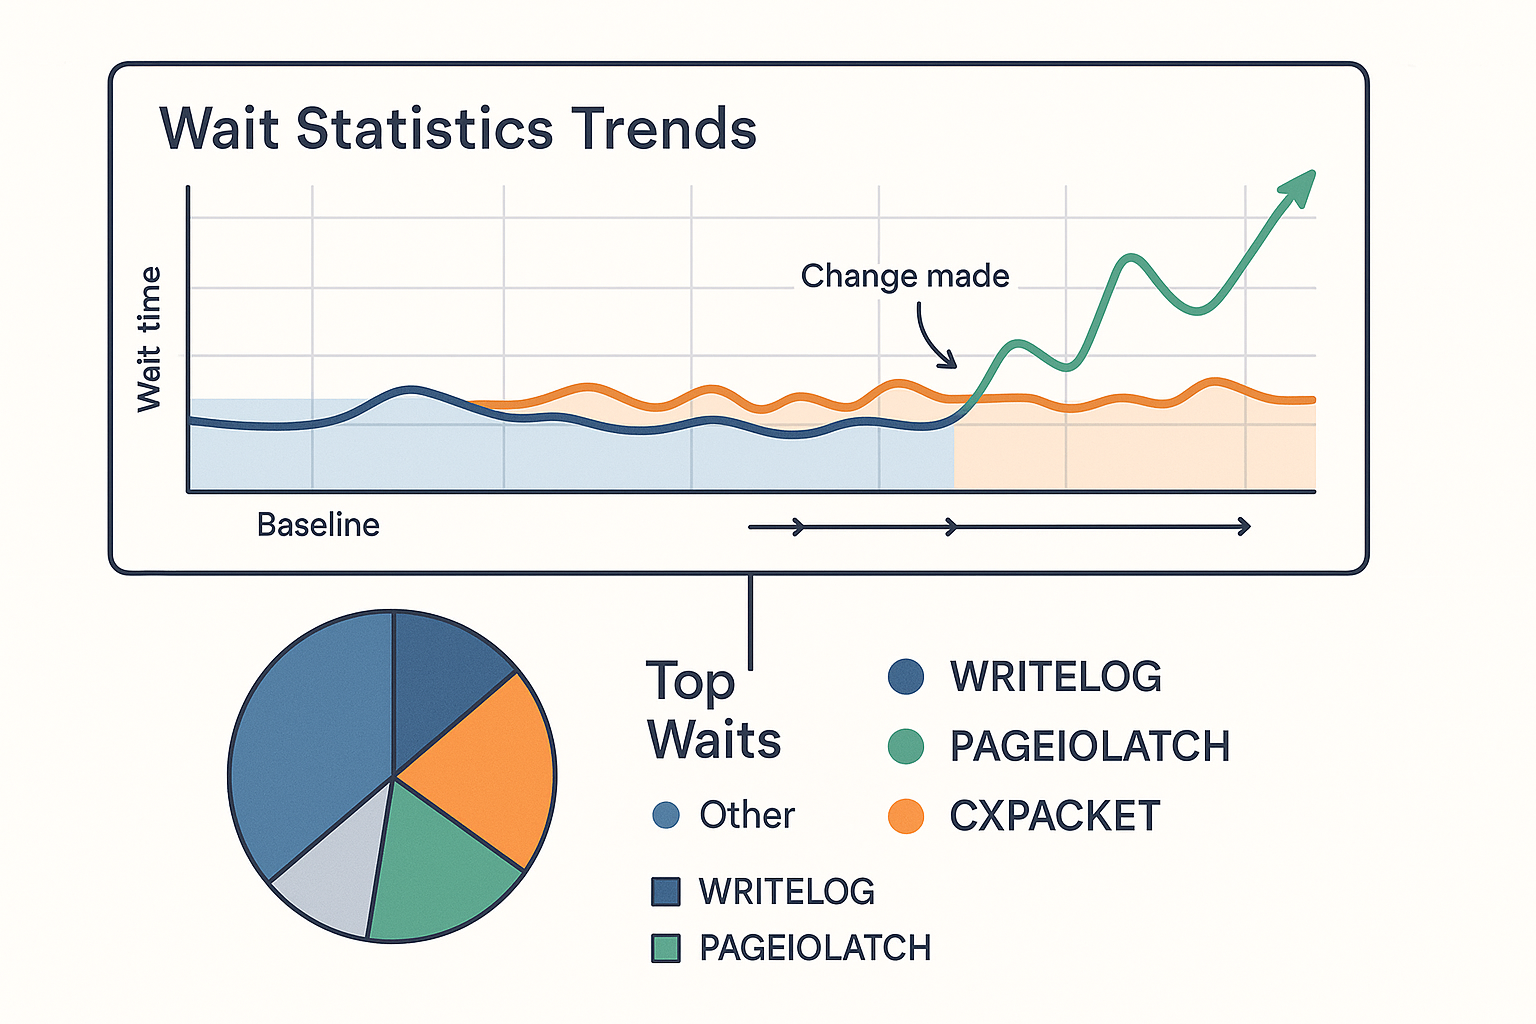
Figure-1: Performance Tuning using SQL Server Wait Statistics
Common Wait Types
There are 1,240 SQL Server wait types listed by Paul Randal. In this section, you will see some common wait types. When you investigate wait stats, always focus on top wait types according to wait time. Specially, look out for high wait times associated with the following specific wait types:
CXPACKET
CXPACKET waits happen when SQL Server runs a query using multiple CPUs (parallelism) and some threads have to wait for others to finish. These waits are normal in systems that process large reports or data warehouse queries. However, in OLTP systems (with many small transactions), too much parallelism can slow things down. High CXPACKET waits don’t always mean parallelism is the problem — they often point to a deeper issue like:
- Unbalanced workload between threads,
- Disk IO bottlenecks (PAGEIOLATCH waits),
- Missing indexes or bad query plans.
Instead of turning off parallelism right away, it's better to:
- Investigate the real root cause,
- Tune slow queries,
- Check for blocking (LCK_ waits) or disk reads,
- Adjust cost threshold or max degree of parallelism (MAXDOP) only when necessary.
Sometimes, CXPACKET with LATCH_*, SOS_SCHEDULER_YIELD, and certain latch waits indicates parallelism is the main issue. In such cases, reducing MAXDOP may help.
SOS_SCHEDULER_YIELD
SQL Server uses a special way to manage CPU time called a co-operative, non-preemptive scheduler. This means a query runs for a short time (about 4 milliseconds), then voluntarily gives up the CPU so another task can run. When this happens, SQL Server marks it with the SOS_SCHEDULER_YIELD wait type. This type of wait does not mean the task is waiting for a resource like disk or memory — it just means it is waiting for its turn to run again. That’s why you will not see it in the sys.dm_os_waiting_tasks DMV.
If SOS_SCHEDULER_YIELD wait times are low, it is not a problem — it just shows SQL Server is multitasking as expected. But if the wait time is high, it may mean:
- The queries are using too much CPU,
- The server may need more CPU power,
- Or some queries are poorly written and need to be optimized.
If these waits are high and there are no PAGEIOLATCH_ waits* (which indicate disk issues), then it's likely a CPU issue, not a disk issue. You can check the sys.dm_os_schedulers DMV to dig deeper into how the CPU is being used.
THREADPOOL
An user request can execute once a thread is assigned to it by SQLOS. This wait type signals about the starvation of thread i.e. tasks are waiting but there are not available thread. It could occur at highly-parallelized workloads. The reasons behind are:
- The maximum worker setting is too low,
- or batch executions are taking unusually long, thus reducing the number of workers threads availability
For further investigation, you should check why running queries are taking longer CPU time and optimize them. Even, increasing CPU power could be a solution.
LCK_*
LCK_* wait types specify that blocking is ongoing block in the system and one session is being blocked because another session is holding a lock on the same resource. So, it has to wait until the lock is released.
Disk IO-related waits
PAGEIOLATCH_XX, WRITELOG, and ASYNC_IO_COMPLETION wait types are mostly related to disk I/O bottlenecks. However, the root cause may be:
- queries that ar consuming excessive amounts of memory,
- or simply insufficient memory for the buffer pool
PAGEIOLATCH_XX
These wait types happen when SQL Server needs to read data from disk because the data is not already in memory. It puts a latch (a temporary lock) on the page while fetching it from disk. These wait types are one of the hardest to diagnose correctly. As they point to slow disk I/O, but that is not always the real problem. It could also be:
- Not enough memory to keep data in memory,
- Or badly written queries that read too much data unnecessarily.
So, while it looks like a disk issue, the root cause is often query tuning or missing indexes, not the disk itself.
SELECT DB_NAME(vfs.database_id) AS database_name ,
vfs.database_id ,
vfs.file_id ,
io_stall_read_ms / NULLIF(num_of_reads, 0) AS avg_read_latency ,
io_stall_write_ms / NULLIF(num_of_writes, 0)
AS avg_write_latency ,
io_stall_write_ms / NULLIF(num_of_writes + num_of_writes, 0)
AS avg_total_latency ,
num_of_bytes_read / NULLIF(num_of_reads, 0)
AS avg_bytes_per_read ,
num_of_bytes_written / NULLIF(num_of_writes, 0)
AS avg_bytes_per_write ,
vfs.io_stall ,
vfs.num_of_reads ,
vfs.num_of_bytes_read ,
vfs.io_stall_read_ms ,
vfs.num_of_writes ,
vfs.num_of_bytes_written ,
vfs.io_stall_write_ms ,
size_on_disk_bytes / 1024 / 1024. AS size_on_disk_mbytes ,
physical_name
FROM sys.dm_io_virtual_file_stats(NULL, NULL) AS vfs
JOIN sys.master_files AS mf ON vfs.database_id = mf.database_id
AND vfs.file_id = mf.file_id
ORDER BY avg_total_latency DESC

Query Listing-1
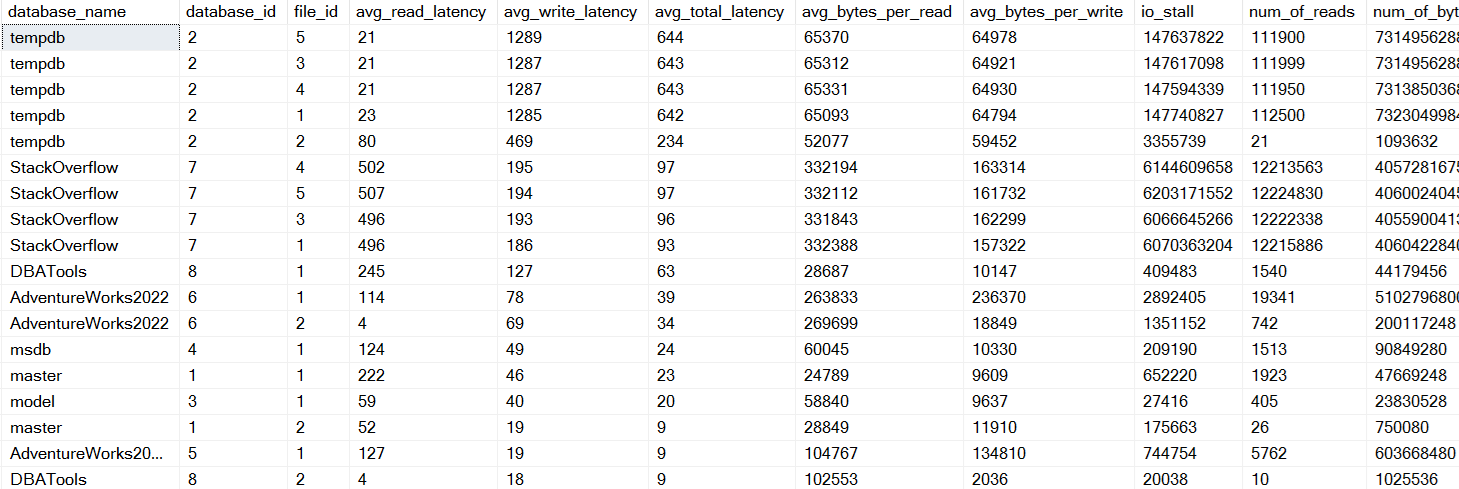
Figure-2: Finding out PAGEIOLATCH_XX
Above Query Listing-1 will help you to find out which files or databases are doing lots of reads or writes, and if any of them are slow. Mainly look at the IO_STALL_* columns to see if there’s high delay (latency) during reading or writing. To double-check, you can also use PerfMon to monitor disk speed using:
- Avg. Disk sec/Read
- Avg. Disk sec/Write
If the latency is more than 10 milliseconds, it usually means something is wrong or too slow — though the acceptable value can vary depending on the system.
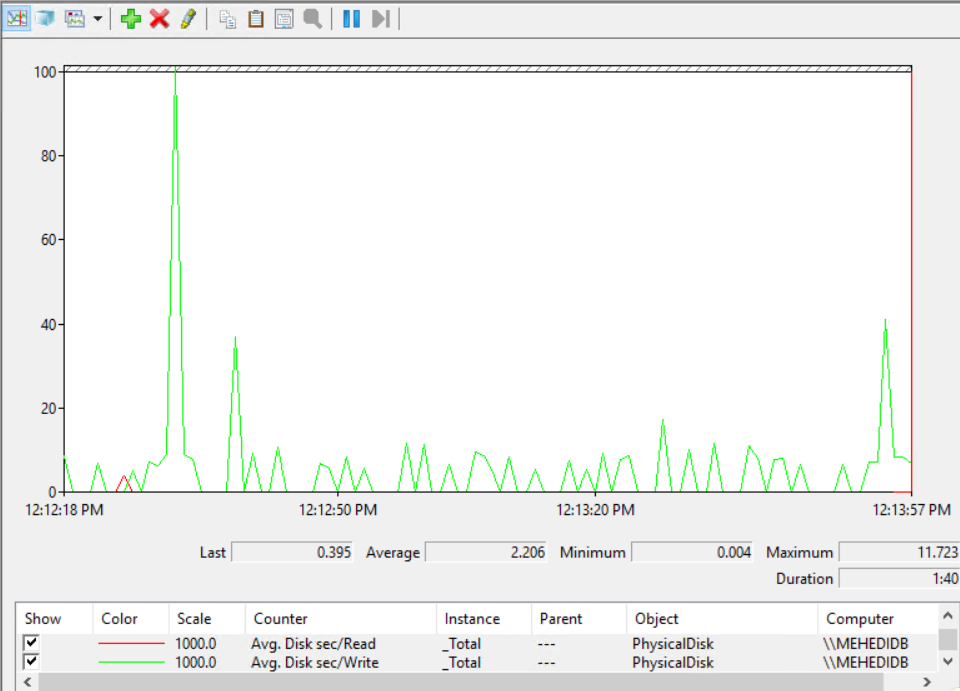
Figure-3: Perfmon Counters - Avg. Disk sec/Read & Avg. Disk sec/Write
PAGEIOLATCH waits due to sub-optimal queries
Many performance issues are caused by inefficient queries or missing indexes. When queries do large table scans instead of targeted seeks, SQL Server ends up reading too many pages, causing high physical and logical I/O. This can lead to PAGEIOLATCH_XX and CXPACKET waits, and overuse of memory (buffer cache).
To fix this, you should:
- Identify which databases and files are causing high I/O.
- Use sys.dm_os_waiting_tasks to see which queries are waiting.
- Check query performance stats using sys.dm_exec_query_stats.
- Focus on queries with the highest physical reads and review their execution plans.
Look for problems like:
- Missing indexes
- Implicit conversions (which block index use)
- Outdated statistics
Fixing these can help SQL Server run queries more efficiently and reduce unnecessary I/O.
PAGEIOLATCH waits due to memory pressure
Sometimes, PAGEIOLATCH_XX waits are caused by memory pressure in SQL Server. This happens when:
- The buffer pool doesn’t have enough memory, or
- It is being overused by other processes.
You can confirm memory pressure by checking PerfMon counters:
- Low or fluctuating Page Life Expectancy
- Non-zero values for Free List Stalls/sec and
- High Lazy Writes/sec
These signs mean SQL Server can not keep data in memory long, so it keeps going to disk — causing high I/O. Memory pressure may be caused by:
- Windows using too much memory
- SQL Server using memory for things like a bloated plan cache (due to many single-use, ad-hoc queries)
Also, if your data size grows (e.g., 1GB → 4GB) but server memory does not increase, then even optimized queries may cause heavy disk reads.
Solution: Add more memory or fix what’s consuming too much memory unnecessarily.
PAGEIOLATCH waits due to disk subsystem issues
Sometimes, the real reason for PAGEIOLATCH_XX waits is simply slow storage. For example, If a database is used for archiving old data to slower disks, it’s normal to see some I/O waits during that time. But if the archiving process is already well-optimized and still slows down other important work, then the storage might be too weak or misconfigured. In that case, you can:
- Upgrade to faster disks, or
- Move the heavy workload (or 'hot' files) to better storage.
WRITELOG
SQL Server uses a system called write-ahead logging to make sure that transactions are safe (durable). This means:
When a transaction changes data, SQL Server first writes details of the change to the transaction log (in memory).
- It also changes the data pages in memory.
- Only after writing all the log records to disk, the transaction is committed.
- SQL Server flushes all log records up to that point, not just the current one.
- The actual data changes in memory are written to disk later, during CHECKPOINTs.
In busy systems with lots of writes, the disk might not keep up with the log writes. This causes WRITELOG waits, meaning SQL Server is waiting to finish writing log data to disk before it can continue. This can be worse if:
- Many databases share the same physical disk for their log files.
- The log files are fragmented or mixed on the disk.
If you see WRITELOG waits in sys.dm_os_wait_stats, check the I/O latency of the log files using sys.dm_io_virtual_file_stats.
WRITELOG waits may mean you need to:
- Improve your log file setup, or
- Reduce unnecessary log activity, like:
- Unused indexes still being maintained
- Too many index rebuilds
- Page splits from indexes with very high fill factor
IO_COMPLETION and ASYNC_IO_COMPLETION
These waits happen when SQL Server is waiting for an I/O operation (like reading or writing) to finish.
IO_COMPLETION waits usually happen during tasks like:
- Loading a file (like a DLL) from disk
- Writing tempdb sort files
- Running DBCC CHECKDB
- Flushing data from sparse files
- And other non-standard I/O tasks (not normal reads/writes of data or logs)
ASYNC_IO_COMPLETION waits often happen during large backup operations. Since backups are done asynchronously, these waits are usually not serious or performance-critical like WRITELOG waits.
Memory waits
One of the memory-related waits that you often observe is the PAGELATCH_XX wait. These waits happen when a thread has to wait to access a page already in memory (in the buffer pool). The most common cause is many sessions accessing tempdb at the same time, especially system pages like PFS, GAM, SGAM. It can also happen when:
- Many users are doing INSERTs into a table with a clustered index on an increasing key (like IDENTITY), causing hotspot contention on one index page.
- Page splits occur during inserts, which require SQL Server to lock pages to manage the split.
You can use sys.dm_os_waiting_tasks to find the queries and objects causing these waits and troubleshoot further.
Creating Wait Stat Baselines
All SQL Server instances will always have some waits, even if they are well-tuned. Seeing the "top 5 waits" in sys.dm_os_wait_stats does not always mean there is a problem — those waits might be normal for that server. The key is to understand what is normal for your specific instance. Once you know that, you can:
- Detect when performance changes
- Spot unusual patterns
- Link changes to events (e.g., new deployments or hardware changes)
For this, you need to establish a baseline of wait statistics over time. So, you should go through below steps:
Clearing Wait Stats
SQL Server always clears the cumulative wait stats of sys.dm_os_wait_stats DMV when it restarts. In addition, you can clear it using Query Listing-2. It is not necessary to regularly clear wait statistics. However, to analyze the data effectively — both to understand what is "normal" and to quickly detect unusual behavior — you should follow a well-defined policy on when and how often wait stats are cleared. This ensures consistent and meaningful comparisons over time.
DBCC SQLPERF ('sys.dm_os_wait_stats', CLEAR);

Query Listing-2
Ideally, you should collect wait statistics during normal activity without clearing them. However, when making changes like adding an index or changing a setting, it's helpful to clear the stats right after the change. This way, you can clearly see how the change affects wait patterns. Query Listing -3 will help you to identify when the Wait Stats was last reset and when the SQL Server was last restarted.
SELECT DB_NAME(vfs.database_id) AS database_name ,
vfs.database_id ,
vfs.file_id ,
io_stall_read_ms / NULLIF(num_of_reads, 0) AS avg_read_latency ,
io_stall_write_ms / NULLIF(num_of_writes, 0)
AS avg_write_latency ,
io_stall_write_ms / NULLIF(num_of_writes + num_of_writes, 0)
AS avg_total_latency ,
num_of_bytes_read / NULLIF(num_of_reads, 0)
AS avg_bytes_per_read ,
num_of_bytes_written / NULLIF(num_of_writes, 0)
AS avg_bytes_per_write ,
vfs.io_stall ,
vfs.num_of_reads ,
vfs.num_of_bytes_read ,
vfs.io_stall_read_ms ,
vfs.num_of_writes ,
vfs.num_of_bytes_written ,
vfs.io_stall_write_ms ,
size_on_disk_bytes / 1024 / 1024. AS size_on_disk_mbytes ,
physical_name
FROM sys.dm_io_virtual_file_stats(NULL, NULL) AS vfs
JOIN sys.master_files AS mf ON vfs.database_id = mf.database_id
AND vfs.file_id = mf.file_id
ORDER BY avg_total_latency DESC
-----------------

SELECT [wait_type] ,
[wait_time_ms] ,
DATEADD(SS, -[wait_time_ms] / 1000, GETDATE())
AS 'Date/TimeCleared' ,
CASE WHEN [wait_time_ms] < 1000
THEN CAST([wait_time_ms] AS VARCHAR(15)) + 'ms'
WHEN [wait_time_ms] BETWEEN 1000 AND 60000
THEN CAST(( [wait_time_ms] / 1000 )
AS VARCHAR(15)) + ' seconds'
WHEN [wait_time_ms] BETWEEN 60001 AND 3600000
THEN CAST(( [wait_time_ms] / 60000 )
AS VARCHAR(15)) + ' minutes'
WHEN [wait_time_ms] BETWEEN 3600001 AND 86400000
THEN CAST(( [wait_time_ms] / 3600000 )
AS VARCHAR(15)) + ' hours'
WHEN [wait_time_ms] > 86400000
THEN CAST(( [wait_time_ms] / 86400000 )
AS VARCHAR(15)) + ' days'
END AS 'TimeSinceCleared'
FROM [sys].[dm_os_wait_stats]
WHERE [wait_type] = 'SQLTRACE_INCREMENTAL_FLUSH_SLEEP';

-- check SQL Server start time - 2008 and higher
SELECT [sqlserver_start_time] FROM [sys].[dm_os_sys_info];

Query Listing - 3
Data Storage
For storing the Wait Stats data, you can use your existing database or any new database as you wish. Then create a table using Query Listing -4.
CREATE TABLE [dbo].[WaitStats](
	[RowNum] [bigint] IDENTITY(1,1) NOT NULL,
	[CaptureDate] [datetime] NULL,
	[WaitType] [nvarchar](120) NULL,
	[Wait_S] [decimal](14, 2) NULL,
	[Resource_S] [decimal](14, 2) NULL,
	[Signal_S] [decimal](14, 2) NULL,
	[WaitCount] [bigint] NULL,
	[Percentage] [decimal](4, 2) NULL,
	[AvgWait_S] [decimal](14, 2) NULL,
	[AvgRes_S] [decimal](14, 2) NULL,
	[AvgSig_S] [decimal](14, 2) NULL,
 CONSTRAINT [PK_WaitStats] PRIMARY KEY CLUSTERED
(
	[RowNum] ASC
)WITH (PAD_INDEX = OFF, STATISTICS_NORECOMPUTE = OFF, IGNORE_DUP_KEY = OFF, ALLOW_ROW_LOCKS = ON, ALLOW_PAGE_LOCKS = ON, OPTIMIZE_FOR_SEQUENTIAL_KEY = OFF) ON [PRIMARY]
) ON [PRIMARY]
GO

ALTER TABLE [dbo].[WaitStats] ADD  CONSTRAINT [DF_WaitStats_CaptureDate]  DEFAULT (getdate()) FOR [CaptureDate]
GO

Query Listing -4
Data Capture
Schedule Query Listing -5 to capture the Wait Stats. Column [Help/Info URL] is excluded from Paul Randal’s query referred in Part-2. You can collect the data daily, weekly or monthly as per your business requirements. Remember, unless you clear the cumulative wait stats of sys.dm_os_wait_stats DMV regularly, the stats show waits since the last reset. The longer the data collects, the harder it is to notice small changes. For example, if there is a one-hour performance issue, that spike might get hidden in a month’s worth of data, making it hard to detect.
INSERT INTO dbo.WaitStats
(
[WaitType] ,
[Wait_S] ,
[Resource_S] ,
[Signal_S] ,
[WaitCount] ,
[Percentage] ,
[AvgWait_S] ,
[AvgRes_S] ,
[AvgSig_S]
)
EXEC ('
-- Last updated October 1, 2021
WITH [Waits] AS
    (SELECT
        [wait_type],
        [wait_time_ms] / 1000.0 AS [WaitS],
        ([wait_time_ms] - [signal_wait_time_ms]) / 1000.0 AS [ResourceS],
        [signal_wait_time_ms] / 1000.0 AS [SignalS],
        [waiting_tasks_count] AS [WaitCount],
        100.0 * [wait_time_ms] / SUM ([wait_time_ms]) OVER() AS [Percentage],
        ROW_NUMBER() OVER(ORDER BY [wait_time_ms] DESC) AS [RowNum]
    FROM sys.dm_os_wait_stats
    WHERE [wait_type] NOT IN (
        -- These wait types are almost 100% never a problem and so they are
        -- filtered out to avoid them skewing the results. Click on the URL
        -- for more information.
        N''BROKER_EVENTHANDLER'', -- https://www.sqlskills.com/help/waits/BROKER_EVENTHANDLER
        N''BROKER_RECEIVE_WAITFOR'', -- https://www.sqlskills.com/help/waits/BROKER_RECEIVE_WAITFOR
        N''BROKER_TASK_STOP'', -- https://www.sqlskills.com/help/waits/BROKER_TASK_STOP
        N''BROKER_TO_FLUSH'', -- https://www.sqlskills.com/help/waits/BROKER_TO_FLUSH
        N''BROKER_TRANSMITTER'', -- https://www.sqlskills.com/help/waits/BROKER_TRANSMITTER
        N''CHECKPOINT_QUEUE'', -- https://www.sqlskills.com/help/waits/CHECKPOINT_QUEUE
        N''CHKPT'', -- https://www.sqlskills.com/help/waits/CHKPT
        N''CLR_AUTO_EVENT'', -- https://www.sqlskills.com/help/waits/CLR_AUTO_EVENT
        N''CLR_MANUAL_EVENT'', -- https://www.sqlskills.com/help/waits/CLR_MANUAL_EVENT
        N''CLR_SEMAPHORE'', -- https://www.sqlskills.com/help/waits/CLR_SEMAPHORE

        -- Maybe comment this out if you have parallelism issues
        N''CXCONSUMER'', -- https://www.sqlskills.com/help/waits/CXCONSUMER

        -- Maybe comment these four out if you have mirroring issues
        N''DBMIRROR_DBM_EVENT'', -- https://www.sqlskills.com/help/waits/DBMIRROR_DBM_EVENT
        N''DBMIRROR_EVENTS_QUEUE'', -- https://www.sqlskills.com/help/waits/DBMIRROR_EVENTS_QUEUE
        N''DBMIRROR_WORKER_QUEUE'', -- https://www.sqlskills.com/help/waits/DBMIRROR_WORKER_QUEUE
        N''DBMIRRORING_CMD'', -- https://www.sqlskills.com/help/waits/DBMIRRORING_CMD
        N''DIRTY_PAGE_POLL'', -- https://www.sqlskills.com/help/waits/DIRTY_PAGE_POLL
        N''DISPATCHER_QUEUE_SEMAPHORE'', -- https://www.sqlskills.com/help/waits/DISPATCHER_QUEUE_SEMAPHORE
        N''EXECSYNC'', -- https://www.sqlskills.com/help/waits/EXECSYNC
        N''FSAGENT'', -- https://www.sqlskills.com/help/waits/FSAGENT
        N''FT_IFTS_SCHEDULER_IDLE_WAIT'', -- https://www.sqlskills.com/help/waits/FT_IFTS_SCHEDULER_IDLE_WAIT
        N''FT_IFTSHC_MUTEX'', -- https://www.sqlskills.com/help/waits/FT_IFTSHC_MUTEX

       -- Maybe comment these six out if you have AG issues
        N''HADR_CLUSAPI_CALL'', -- https://www.sqlskills.com/help/waits/HADR_CLUSAPI_CALL
        N''HADR_FILESTREAM_IOMGR_IOCOMPLETION'', -- https://www.sqlskills.com/help/waits/HADR_FILESTREAM_IOMGR_IOCOMPLETION
        N''HADR_LOGCAPTURE_WAIT'', -- https://www.sqlskills.com/help/waits/HADR_LOGCAPTURE_WAIT
        N''HADR_NOTIFICATION_DEQUEUE'', -- https://www.sqlskills.com/help/waits/HADR_NOTIFICATION_DEQUEUE
        N''HADR_TIMER_TASK'', -- https://www.sqlskills.com/help/waits/HADR_TIMER_TASK
        N''HADR_WORK_QUEUE'', -- https://www.sqlskills.com/help/waits/HADR_WORK_QUEUE

        N''KSOURCE_WAKEUP'', -- https://www.sqlskills.com/help/waits/KSOURCE_WAKEUP
        N''LAZYWRITER_SLEEP'', -- https://www.sqlskills.com/help/waits/LAZYWRITER_SLEEP
        N''LOGMGR_QUEUE'', -- https://www.sqlskills.com/help/waits/LOGMGR_QUEUE
        N''MEMORY_ALLOCATION_EXT'', -- https://www.sqlskills.com/help/waits/MEMORY_ALLOCATION_EXT
        N''ONDEMAND_TASK_QUEUE'', -- https://www.sqlskills.com/help/waits/ONDEMAND_TASK_QUEUE
        N''PARALLEL_REDO_DRAIN_WORKER'', -- https://www.sqlskills.com/help/waits/PARALLEL_REDO_DRAIN_WORKER
        N''PARALLEL_REDO_LOG_CACHE'', -- https://www.sqlskills.com/help/waits/PARALLEL_REDO_LOG_CACHE
        N''PARALLEL_REDO_TRAN_LIST'', -- https://www.sqlskills.com/help/waits/PARALLEL_REDO_TRAN_LIST
        N''PARALLEL_REDO_WORKER_SYNC'', -- https://www.sqlskills.com/help/waits/PARALLEL_REDO_WORKER_SYNC
        N''PARALLEL_REDO_WORKER_WAIT_WORK'', -- https://www.sqlskills.com/help/waits/PARALLEL_REDO_WORKER_WAIT_WORK
        N''PREEMPTIVE_OS_FLUSHFILEBUFFERS'', -- https://www.sqlskills.com/help/waits/PREEMPTIVE_OS_FLUSHFILEBUFFERS
        N''PREEMPTIVE_XE_GETTARGETSTATE'', -- https://www.sqlskills.com/help/waits/PREEMPTIVE_XE_GETTARGETSTATE
        N''PVS_PREALLOCATE'', -- https://www.sqlskills.com/help/waits/PVS_PREALLOCATE
        N''PWAIT_ALL_COMPONENTS_INITIALIZED'', -- https://www.sqlskills.com/help/waits/PWAIT_ALL_COMPONENTS_INITIALIZED
        N''PWAIT_DIRECTLOGCONSUMER_GETNEXT'', -- https://www.sqlskills.com/help/waits/PWAIT_DIRECTLOGCONSUMER_GETNEXT
        N''PWAIT_EXTENSIBILITY_CLEANUP_TASK'', -- https://www.sqlskills.com/help/waits/PWAIT_EXTENSIBILITY_CLEANUP_TASK
        N''QDS_PERSIST_TASK_MAIN_LOOP_SLEEP'', -- https://www.sqlskills.com/help/waits/QDS_PERSIST_TASK_MAIN_LOOP_SLEEP
        N''QDS_ASYNC_QUEUE'', -- https://www.sqlskills.com/help/waits/QDS_ASYNC_QUEUE
        N''QDS_CLEANUP_STALE_QUERIES_TASK_MAIN_LOOP_SLEEP'',
            -- https://www.sqlskills.com/help/waits/QDS_CLEANUP_STALE_QUERIES_TASK_MAIN_LOOP_SLEEP
        N''QDS_SHUTDOWN_QUEUE'', -- https://www.sqlskills.com/help/waits/QDS_SHUTDOWN_QUEUE
        N''REDO_THREAD_PENDING_WORK'', -- https://www.sqlskills.com/help/waits/REDO_THREAD_PENDING_WORK
        N''REQUEST_FOR_DEADLOCK_SEARCH'', -- https://www.sqlskills.com/help/waits/REQUEST_FOR_DEADLOCK_SEARCH
        N''RESOURCE_QUEUE'', -- https://www.sqlskills.com/help/waits/RESOURCE_QUEUE
        N''SERVER_IDLE_CHECK'', -- https://www.sqlskills.com/help/waits/SERVER_IDLE_CHECK
        N''SLEEP_BPOOL_FLUSH'', -- https://www.sqlskills.com/help/waits/SLEEP_BPOOL_FLUSH
        N''SLEEP_DBSTARTUP'', -- https://www.sqlskills.com/help/waits/SLEEP_DBSTARTUP
        N''SLEEP_DCOMSTARTUP'', -- https://www.sqlskills.com/help/waits/SLEEP_DCOMSTARTUP
        N''SLEEP_MASTERDBREADY'', -- https://www.sqlskills.com/help/waits/SLEEP_MASTERDBREADY
        N''SLEEP_MASTERMDREADY'', -- https://www.sqlskills.com/help/waits/SLEEP_MASTERMDREADY
        N''SLEEP_MASTERUPGRADED'', -- https://www.sqlskills.com/help/waits/SLEEP_MASTERUPGRADED
        N''SLEEP_MSDBSTARTUP'', -- https://www.sqlskills.com/help/waits/SLEEP_MSDBSTARTUP
        N''SLEEP_SYSTEMTASK'', -- https://www.sqlskills.com/help/waits/SLEEP_SYSTEMTASK
        N''SLEEP_TASK'', -- https://www.sqlskills.com/help/waits/SLEEP_TASK
        N''SLEEP_TEMPDBSTARTUP'', -- https://www.sqlskills.com/help/waits/SLEEP_TEMPDBSTARTUP
        N''SNI_HTTP_ACCEPT'', -- https://www.sqlskills.com/help/waits/SNI_HTTP_ACCEPT
        N''SOS_WORK_DISPATCHER'', -- https://www.sqlskills.com/help/waits/SOS_WORK_DISPATCHER
        N''SP_SERVER_DIAGNOSTICS_SLEEP'', -- https://www.sqlskills.com/help/waits/SP_SERVER_DIAGNOSTICS_SLEEP
        N''SQLTRACE_BUFFER_FLUSH'', -- https://www.sqlskills.com/help/waits/SQLTRACE_BUFFER_FLUSH
        N''SQLTRACE_INCREMENTAL_FLUSH_SLEEP'', -- https://www.sqlskills.com/help/waits/SQLTRACE_INCREMENTAL_FLUSH_SLEEP
        N''SQLTRACE_WAIT_ENTRIES'', -- https://www.sqlskills.com/help/waits/SQLTRACE_WAIT_ENTRIES
        N''VDI_CLIENT_OTHER'', -- https://www.sqlskills.com/help/waits/VDI_CLIENT_OTHER
        N''WAIT_FOR_RESULTS'', -- https://www.sqlskills.com/help/waits/WAIT_FOR_RESULTS
        N''WAITFOR'', -- https://www.sqlskills.com/help/waits/WAITFOR
        N''WAITFOR_TASKSHUTDOWN'', -- https://www.sqlskills.com/help/waits/WAITFOR_TASKSHUTDOWN
        N''WAIT_XTP_RECOVERY'', -- https://www.sqlskills.com/help/waits/WAIT_XTP_RECOVERY
        N''WAIT_XTP_HOST_WAIT'', -- https://www.sqlskills.com/help/waits/WAIT_XTP_HOST_WAIT
        N''WAIT_XTP_OFFLINE_CKPT_NEW_LOG'', -- https://www.sqlskills.com/help/waits/WAIT_XTP_OFFLINE_CKPT_NEW_LOG
        N''WAIT_XTP_CKPT_CLOSE'', -- https://www.sqlskills.com/help/waits/WAIT_XTP_CKPT_CLOSE
        N''XE_DISPATCHER_JOIN'', -- https://www.sqlskills.com/help/waits/XE_DISPATCHER_JOIN
        N''XE_DISPATCHER_WAIT'', -- https://www.sqlskills.com/help/waits/XE_DISPATCHER_WAIT
        N''XE_TIMER_EVENT'' -- https://www.sqlskills.com/help/waits/XE_TIMER_EVENT
        )
    AND [waiting_tasks_count] > 0
    )
SELECT
    MAX ([W1].[wait_type]) AS [WaitType],
    CAST (MAX ([W1].[WaitS]) AS DECIMAL (16,2)) AS [Wait_S],
    CAST (MAX ([W1].[ResourceS]) AS DECIMAL (16,2)) AS [Resource_S],
    CAST (MAX ([W1].[SignalS]) AS DECIMAL (16,2)) AS [Signal_S],
    MAX ([W1].[WaitCount]) AS [WaitCount],
    CAST (MAX ([W1].[Percentage]) AS DECIMAL (5,2)) AS [Percentage],
    CAST ((MAX ([W1].[WaitS]) / MAX ([W1].[WaitCount])) AS DECIMAL (16,4)) AS [AvgWait_S],
    CAST ((MAX ([W1].[ResourceS]) / MAX ([W1].[WaitCount])) AS DECIMAL (16,4)) AS [AvgRes_S],
    CAST ((MAX ([W1].[SignalS]) / MAX ([W1].[WaitCount])) AS DECIMAL (16,4)) AS [AvgSig_S]
FROM [Waits] AS [W1]
INNER JOIN [Waits] AS [W2] ON [W2].[RowNum] <= [W1].[RowNum]
GROUP BY [W1].[RowNum]
HAVING SUM ([W2].[Percentage]) - MAX( [W1].[Percentage] ) < 95; -- percentage threshold
')
GO

Query Listing -5
Reviewing the Data
You can analyze the data in many ways. However, you should focus on the top wait types of the system and how they are changing over time. In a stable system, they should be consistent. As a starting point, you can consider one of the three options of clearing, capturing, and reviewing wait stats data:
Option 1:
- Never clear wait statistics
- Capture weekly (at the end of any business day)
- Review weekly
Option 2:
- Clear wait statistics on Sunday nights (or after a full weekly backup)
- Capture daily at the end of the business day
- Review daily, checking to see if the percentages for wait types vary throughout the week
Option 3:
- Clear wait statistics nightly (after full or differential backups complete)
- Capture daily, at the end of the business day (optional: capture after any evening or overnight processing)
- Review daily, checking to see how the waits and their percentages vary throughout the week (and throughout the day if capturing more than once a day)
The main goal of collecting wait statistics is to understand what is "normal" for your system. While doing this, you may also discover existing or potential performance issues—which is actually helpful. It lets you find and fix problems before they affect production.
Final Words
Understanding SQL Server Wait Statistics is crucial for diagnosing performance issues and ensuring your systems run efficiently. Throughout this three-part series, we explored the fundamentals of wait stats, how to identify and interpret common wait types, and the importance of establishing baselines for meaningful analysis.
While some waits are inevitable, recognizing unusual patterns and knowing how to respond is what separates reactive troubleshooting from proactive performance tuning. By regularly monitoring and reviewing wait statistics, DBAs can uncover hidden bottlenecks, validate the impact of configuration changes, and maintain a healthy SQL Server environment.
With the right tools, processes, and mindset, wait statistics become more than just numbers—they become powerful insights that guide smarter decisions and deliver smoother, faster database performance.
References
Going Further
If SQL Server is your thing and you enjoy learning real-world tips, tricks, and performance hacks—you are going to love my training sessions too!
Need results fast? I am also available for 1-on-1 consultancy to help you troubleshoot and fix your database performance issues.
Let’s make your SQL Server to take your business Challenge!
For any queries, mail to mamehedi.hasan[at]gmail.com.