Monitoring real-time activity inside SQL Server is one of the most essential tasks for a DBA. Whether users are complaining about slow performance, reports are taking longer than usual, or your CPU suddenly spikes to 90%, the first question you ask yourself is — "What is running right now?". SQL Server offers several built-in tools such as Activity Monitor, sp_who2, and Dynamic Management Views (DMVs). During such critical moment, often these tools fall short to provide quick, accurate, and detailed insights.
To fill this gap, sp_WhoIsActive is emerged, which is opensource, lightweight, feature-rich, and incredibly efficient at showing what SQL Server is doing at any given moment. Thus, it becomes one of the most powerful diagnostic tools in a DBA’s toolkit.
In this series, I will cover installation, important output columns, diagnosing blocking, deadlocks, wait statistics, memory grants & TempDB usage, logging activity and advanced parameters. Let's start.
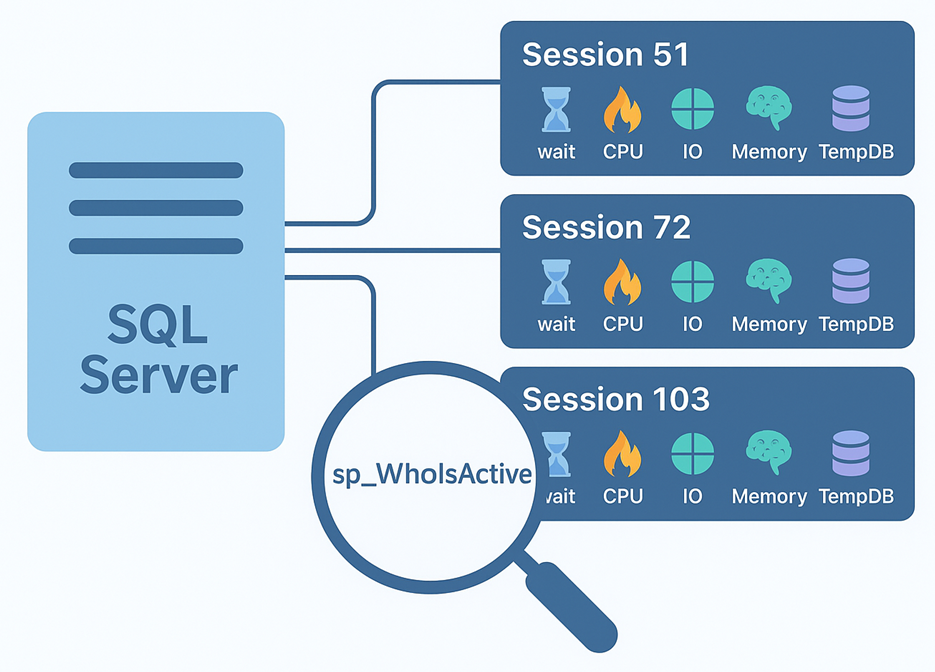
Figure-1: sp_WhoIsActive
About the Developer
Adam Machanic, author, MVP, DBA, is developing gradually sp_WhoIsActive since 2007. Tens of thousands of DBAs daily use this award winning tool to gain insights about their SQL Servers.
Design Philosophy
Adam Machanic built the stored procedure in such a way that it:
- Displays relevant data only
- Shows simple and easily-digestible information
- Impacts the server less and returns data quickly
- Exhibits as much data as possible without overwhelming
- Easily configurable
- Safe and secured
- Supports version compatibility
Installation
Download it from github. Open the unzipped file in SSMS and execute it in your master database. It needs VIEW SERVER STATE permission for accessing various instance-global DMVs.
Common Columns
If you run sp_WhoIsActive without any parameters, it will retrieve following columns, broken into four basic categories:
- Time and Status
- [dd hh:mm:ss.mss] - Elapsed time i.e. how much time a query has been running
- [start_time] - The timestamp when the query was started
- [percent_complete] - How much percent the query is completed
- [collection_time] - When you run the sp_WhoIsActive
- [status] - Query's current status (sleeping, dormant, runnable, suspended, etc.)
- Identifiers
- [session_id] - Query's session id
- [request_id] - Request id
- [login_name] - login name associated with the query
- [host_name] - The hostname from where the query was spawned
- [database_name] - The database name where the query is executing
- [program_name] - The application that run the query
- Things Slowing Down Your Query
- [wait_info] - Query's cumulative wait information (NULL, in case not waiting for).
- [blocking_session_id] - Session id that is blocking this query.
- Things Your Session is Doing
- [sql_text] - Ongoing query commands.
- [CPU] - Query's consuming CPU time (in milliseconds).
- [tempdb_allocations] - Total pages allocated for this query in TempDB due to temporary tables, LOB types, spools, or other consumers.
- [tempdb_current] - Current consumption of TempDB pages (Total allocated pages - total deallocated pages) for this query.
- [reads] - Total logical reads (in 8KB pages).
- [writes] - Total logical writes (in 8KB pages).
- [physical_reads] - Total physical reads (in 8KB pages).
- [used_memory] - Total memory (Procedure cache memory + workspace memory grant) used (in 8KB pages).
- [open_tran_count] - Total nested transactions opened by the query.
Parameters and Helps
Executing EXEC sp_WhoIsActive @help = 1 will display all the parameters and short description about them (Figure-3). 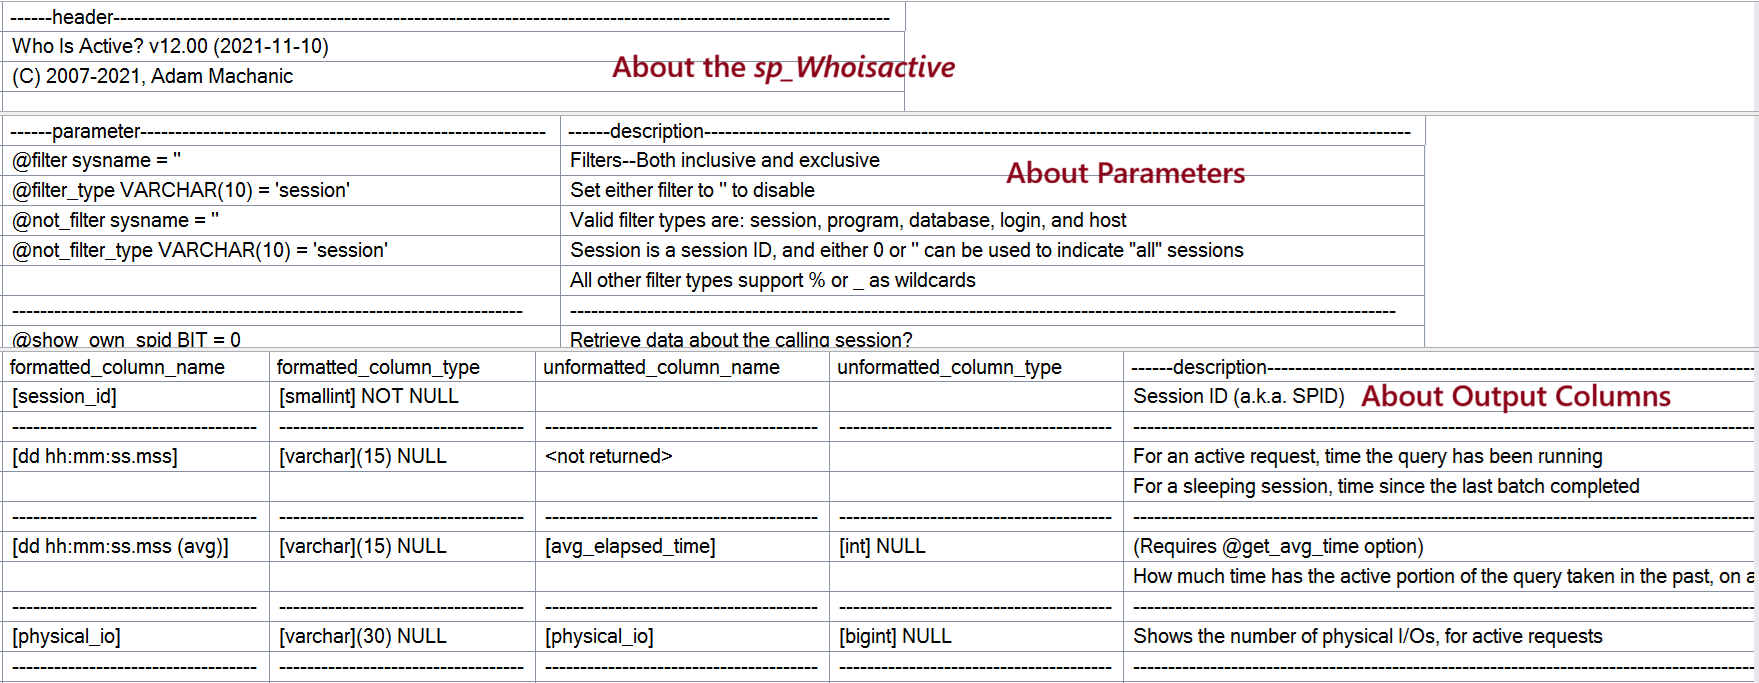
Figure-2: sp_WhoIsActive's Help
EXEC sp_WhoIsActive
    @filter = '',
    @filter_type = 'session',
    @not_filter = '',
    @not_filter_type = 'session',
    @show_own_spid = 0,
    @show_system_spids = 0,
    @show_sleeping_spids = 1,
    @get_full_inner_text = 0,
    @get_plans = 0,
    @get_outer_command = 0,
    @get_transaction_info = 0,
    @get_task_info = 1,
    @get_locks = 0,
    @get_avg_time = 0,
    @get_additional_info = 0,
    @find_block_leaders = 0,
    @delta_interval = 0,
    @output_column_list = '[dd%][session_id][sql_text][sql_command][login_name][wait_info][tasks][tran_log%][cpu%][temp%][block%][reads%][writes%][context%][physical%][query_plan][locks][%]',
    @sort_order = '[start_time] ASC',
    @format_output = 1,
    @destination_table = '',
    @return_schema = 0,
    @schema = NULL,
    @help = 0
Filters
This tool support following filters and also not-filter options:
- session - filters on the [session_id] column
- program - filters on the [program_name] column
- database - filters on the [database_name] column
- login - filters on the [login_name] column
- host - filters on the [host_name] column
EXEC sp_WhoIsActive -- Filter example
    @filter_type = 'login',
    @filter = 'Mehedi%';

EXEC sp_WhoIsActive -- Not filter example
    @not_filter_type = 'login',
    @not_filter = 'Hasan';
Final Words
In this first part, we established the foundation for understanding sp_WhoIsActive, it's parameters, output columns and filter types. Next part, we will explore more deeply.
References
Going Further
If SQL Server is your thing and you enjoy learning real-world tips, tricks, and performance hacks—you are going to love my training sessions too!
Need results fast? I am also available for 1-on-1 consultancy to help you troubleshoot and fix your database performance issues.
Let’s make your SQL Server to take your business Challenge!
For any queries, mail to mamehedi.hasan[at]gmail.com.