Do you know SQL Server keeps an inventory of your SQL queries, where you could track performance, pinpoint bottlenecks, and instantly access the history of every executed query. Even you could force a regressed query to use its previous plan! That is the power of SQL Query Store. The built-in performance tuning tool that provides deep insights into query performance over time. In this article, you will see how Query Store can be used to troubleshoot and optimize your query performance.
Query Store
SQL Query Store collects and stores historical query execution data and helps to analyze query performance over time. It tracks query text, execution plans, resource usage, and runtime statistics, enabling you to identify and resolve performance issues, detect regressions, and understand the impact of plan changes. Essentially, Query Store acts like a "flight recorder" for your database, capturing detailed information that aids in tuning and optimizing queries efficiently.
Query Store is useful for:
- Identifying performance regression due execution plan changes. Fix it by forcing query to use a old plan.
- Auditing number of times a specific query was executed within a time frame. It will help you to troubleshoot performance resource problems.
- Determining the most expensive queries in terms of CPU, I/O, memory etc.
- Checking the history of query plans for a specific query.
- Analyzing CPU, I/O, and memory utilization patterns of your workload.
- Finding out top queries that are waiting on resources.
- Understanding wait nature for a specific query plan.
The Query Store contains three stores:
- Plan store - contains execution plan info.
- Runtime stats store - saves execution statistics info.
- Wait stats store - caches wait statistics info.
Enable Query Store
You can setup Query Store specific to a database. In this example, we will use AdventureWorks2022 database. As shown in Diagram -1, right click on the database name then from Properties, choose the Query Store options.
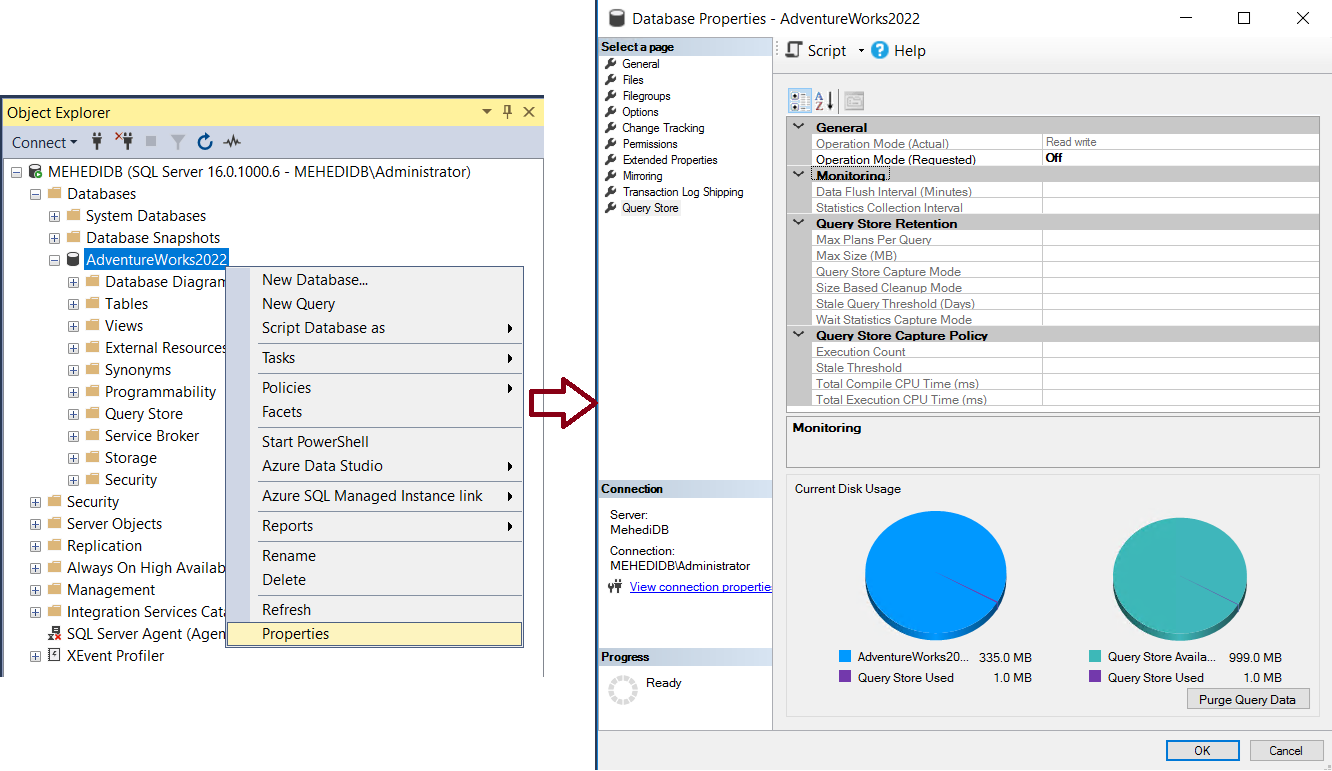
Diagram - 1: Enable Query Store
As shown in Diagram -2, select Read write options from drop down of the Operation Mode (Requested) and click OK. It will enable Query Store.
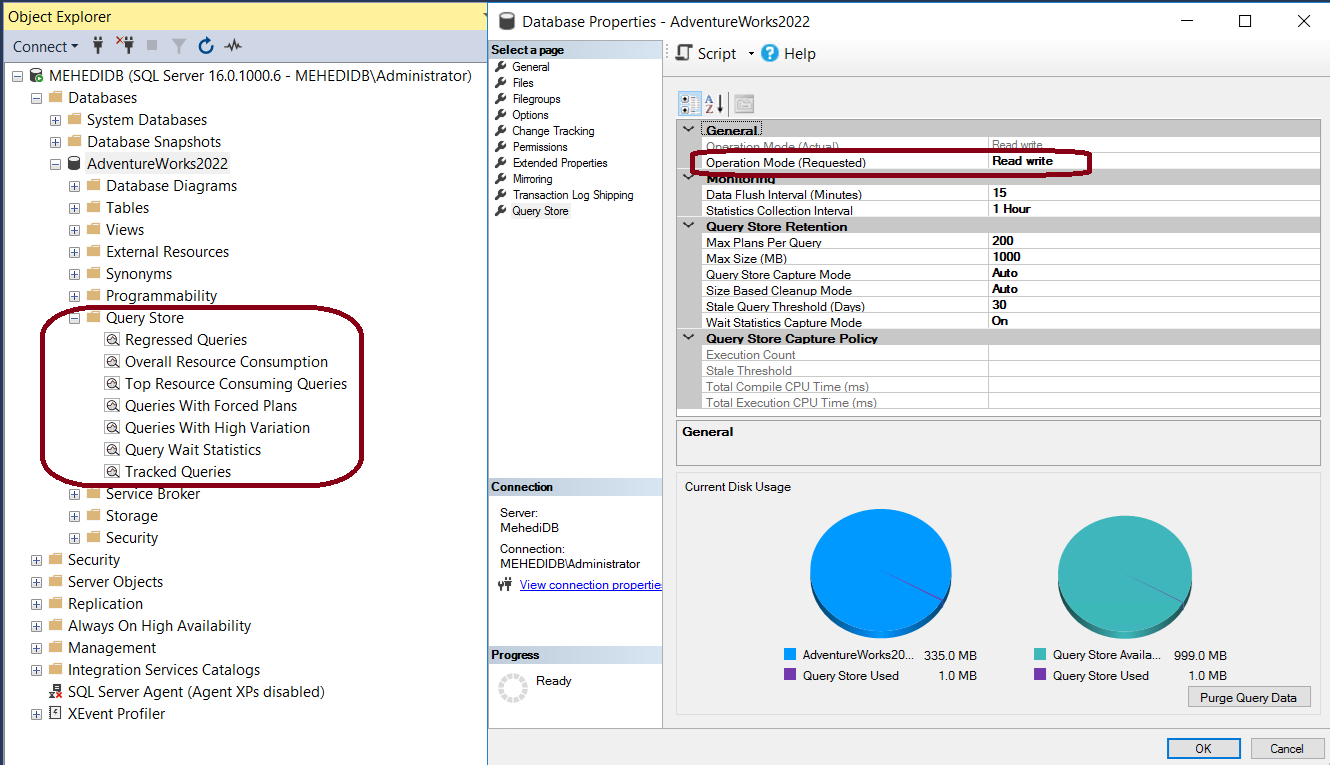
Diagram - 2: Enable Query Store
Configurations
There are some options for Query Store. You can select the options from drop down list.
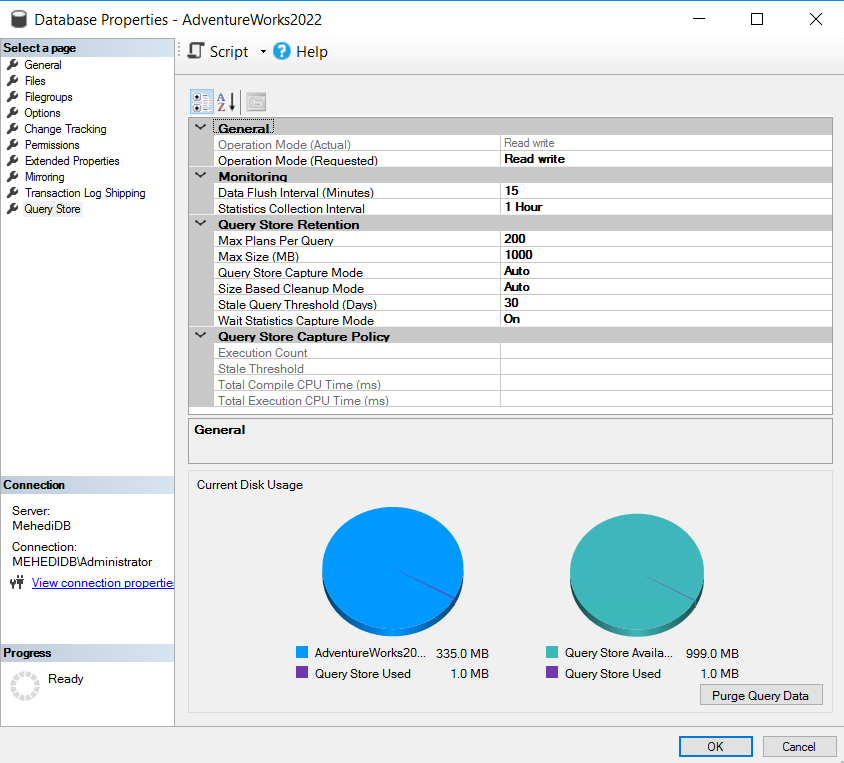
Diagram - 3: Configure Query Store
- Operation Mode (Actual) - It shows the state of the Query Store. It is in read-only mode.
- Operation Mode (Requested) - It has three options:
- Off – Query Store is in disabled state
- Read Only – new query execution plans or statistics will not be captured
- Read Write – capture query execution plans and statistics
- Data Flush Interval (Minutes) – how frequently the execution plans and statistics will be flushed from memory of SQL Server instance to disk. Default value is 15 minutes.
- Statistics Collection Interval – how frequently the statistics will be captured. Default value is 1 hour. Lower value means more statistics resulting more disk space for storing the statistics.
- Max Plans Per Query – maximum number of plans stores for a query. Setting it to 0 will store all plans.
- Max Size (MB) – maximum size of the Query Store.
- Query Store Capture Mode - It has below options:
- All – capture all
- Auto – based on resource consumption
- None – no new query will be captured
- Custom – based on custom capture policy
- Size Based Cleanup Mode – It has below options:
- Auto – cleanup data when max size reached
- Off – no data cleanup
- Stale Query Threshold (Days) – how long the data will stay in the Query Store.
- Wait statistics capture mode – enable or disable the capture mode.
Query Store Report Views
As highlighted in Diagram - 4, you will get following views instantly from Query Store which will be helpful to identify what might affecting your database server's performance:
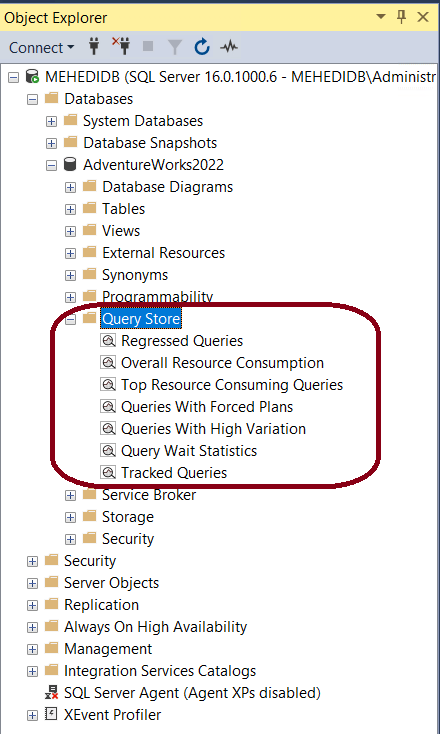
Diagram - 4: Query Store report
Regressed Queries
The Regressed Query view helps you quickly identify queries whose performance metrics has worsened over time, allowing you to target and resolve issues before they impact your users.
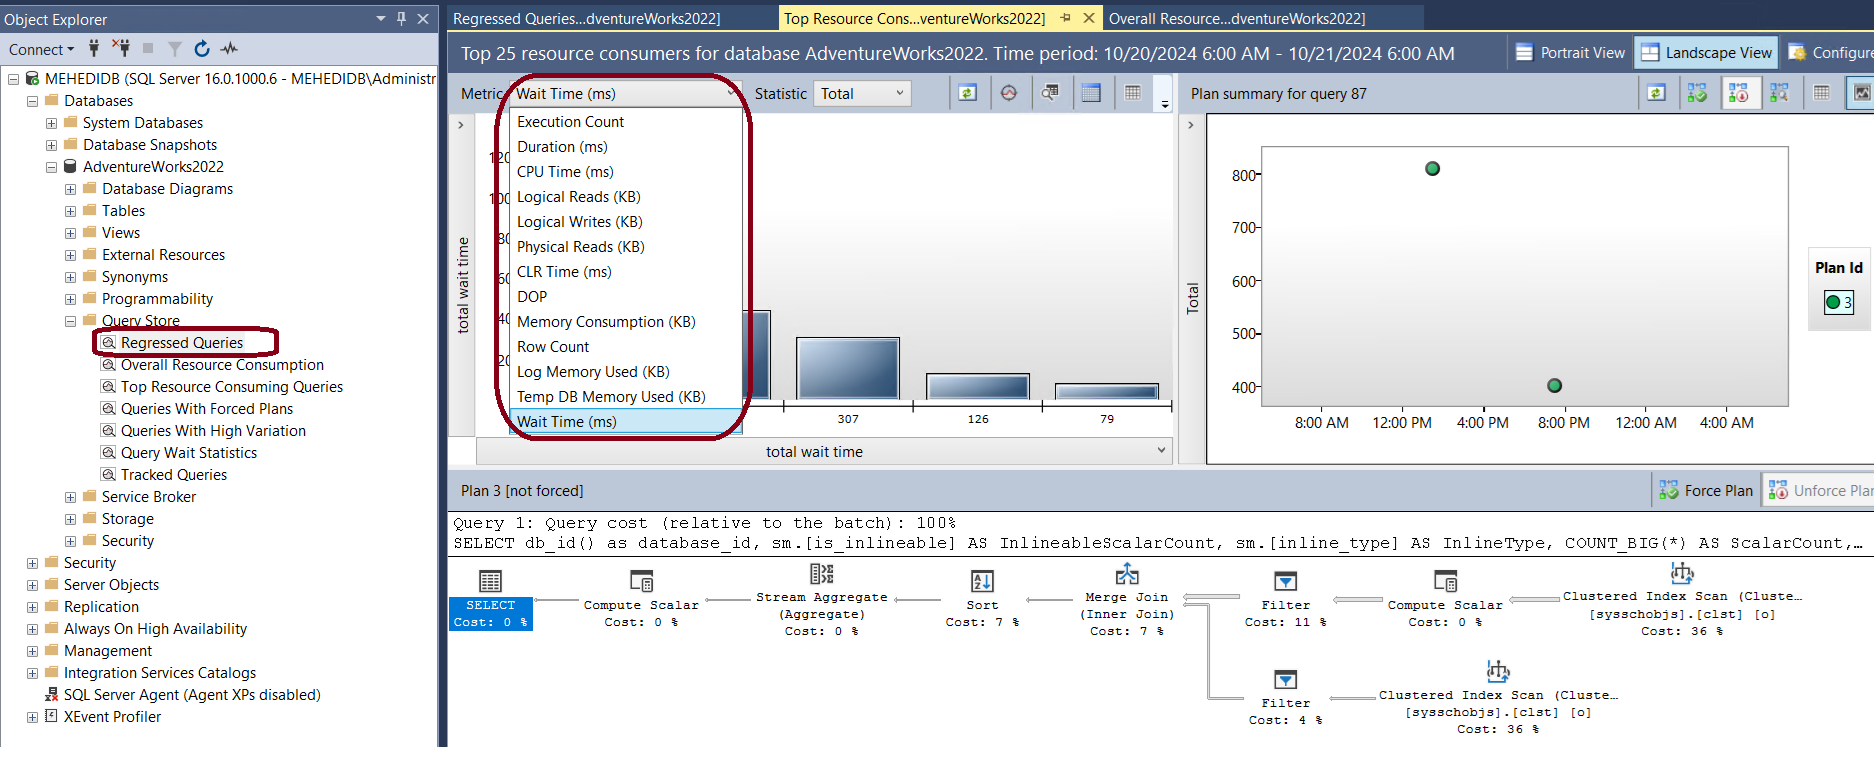
Diagram - 5: Regressed Queries
Overall Resource Consumption
The Overall Resource Consumption view in SQL Query Store provides a snapshot of your database’s resource usage, helping you analyze trends in CPU, memory, and I/O consumption to optimize performance.
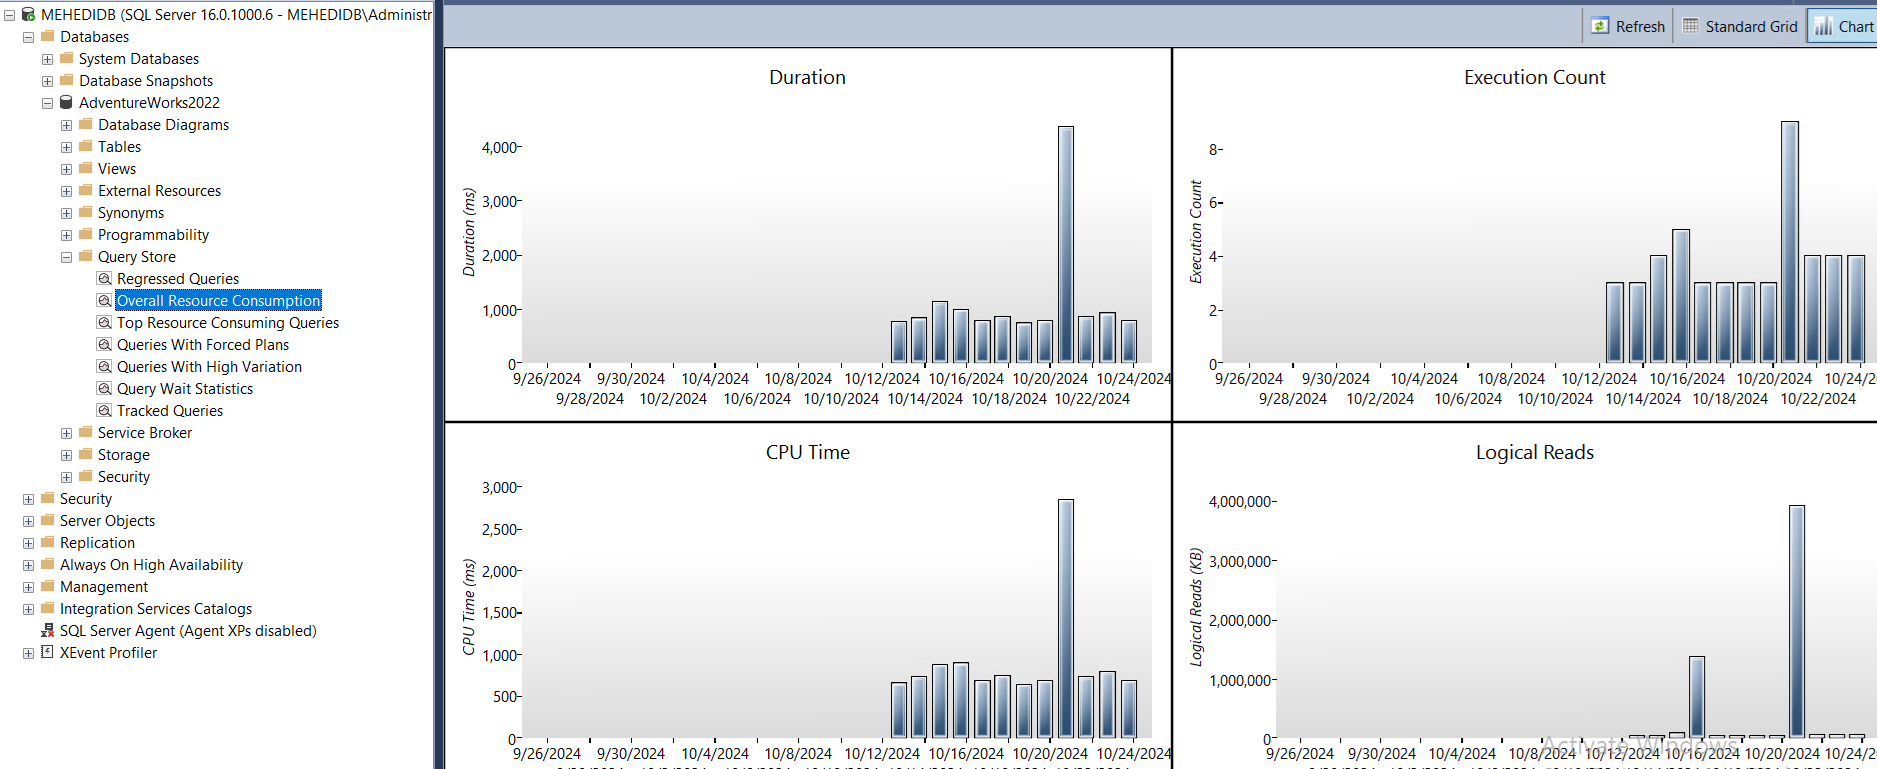
Diagram - 6: Overall Resource Consumption
Top Resource Consuming Queries
Displays the queries which are using the database resource most.
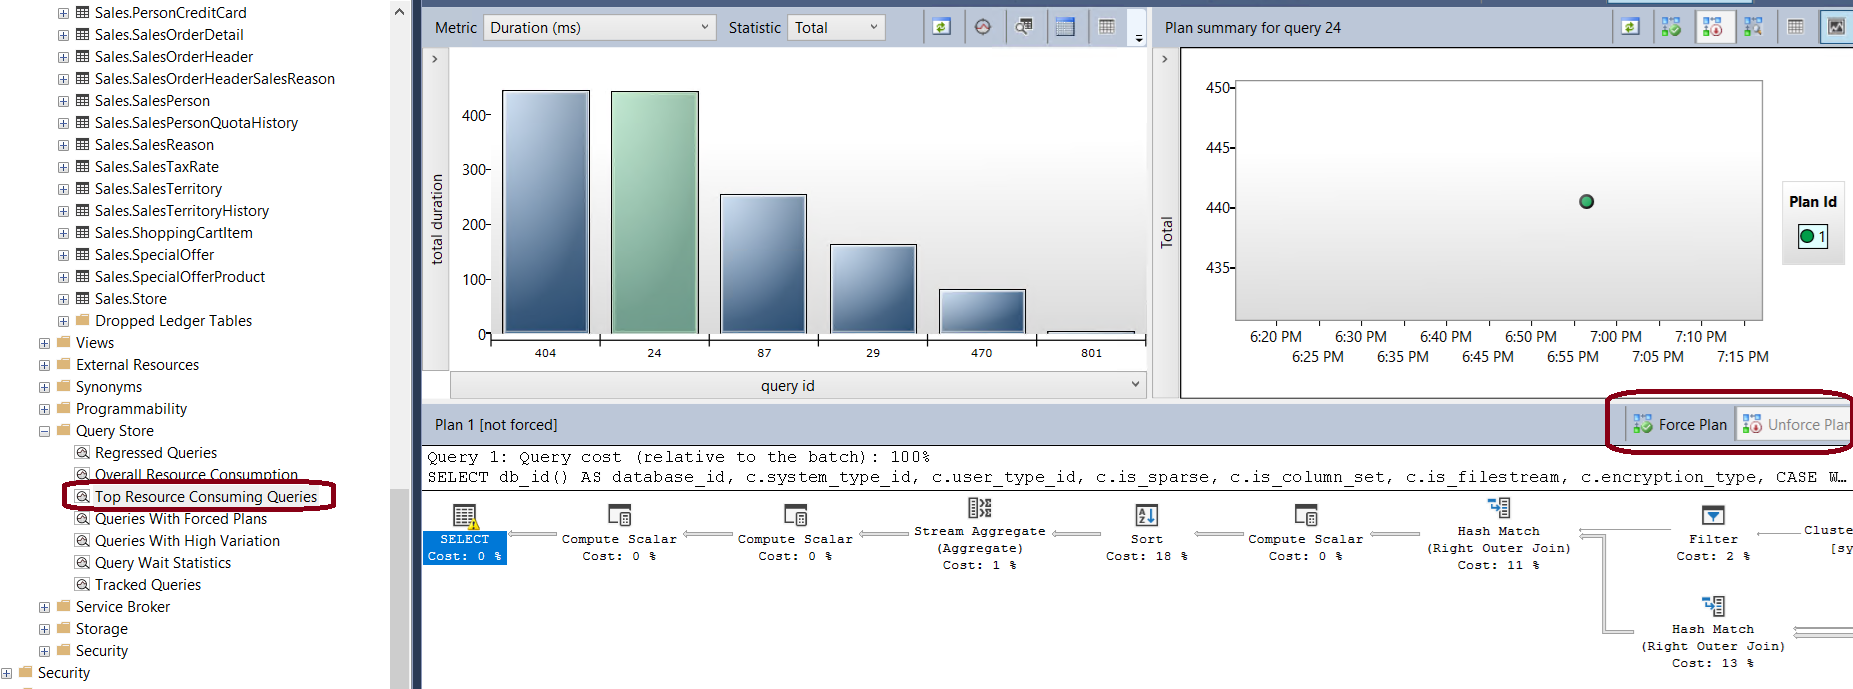
Diagram - 7: Top Resource Consuming Queries
Queries With Forced Plans
Lists down all currently forced plans.
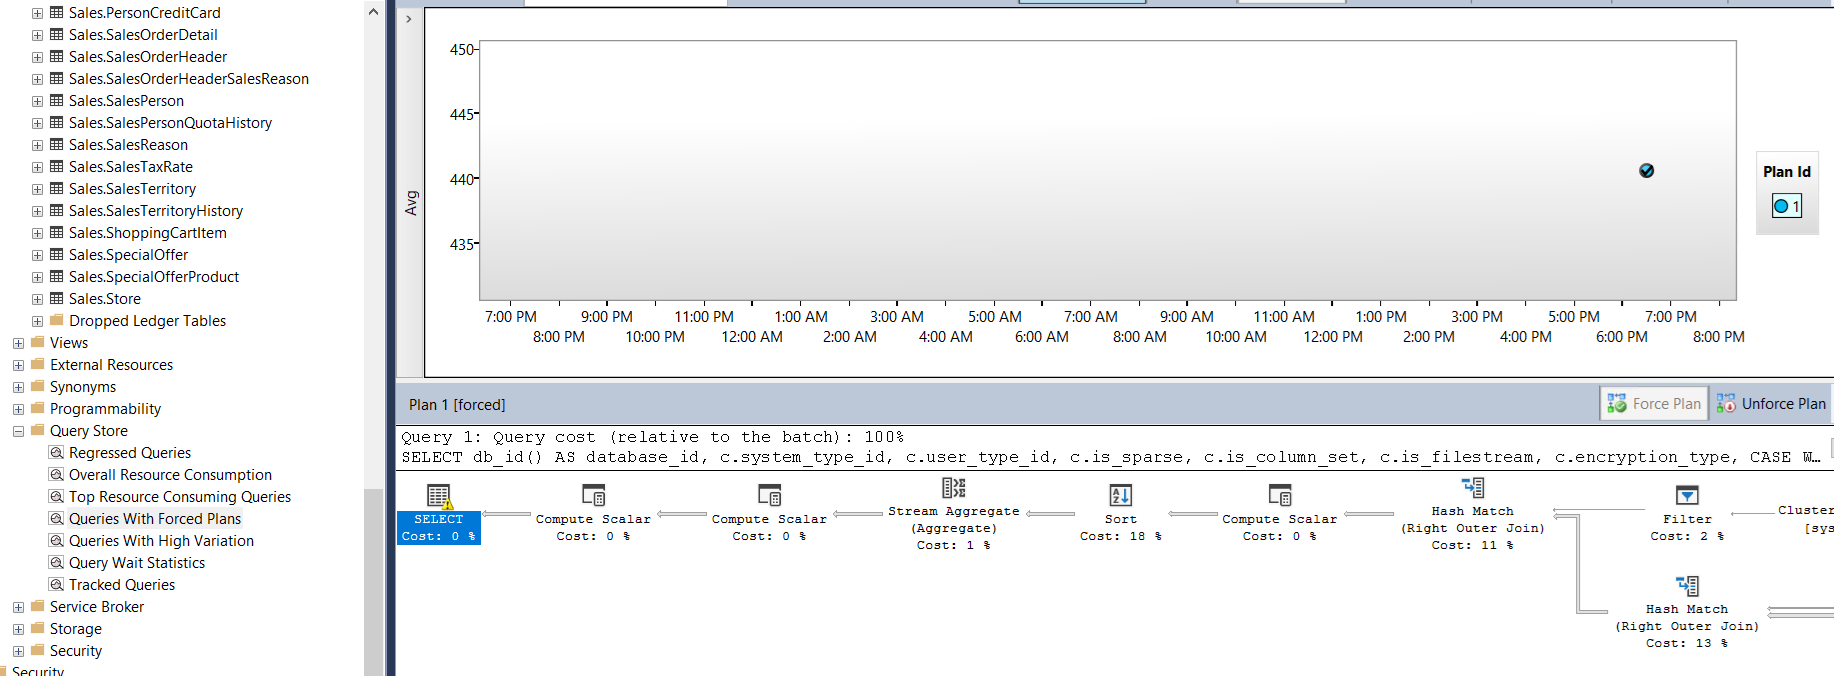
Diagram - 8: Top Resource Consuming Queries
Queries With High Variation
Shows the queries whose performance can be affecting your database performance.
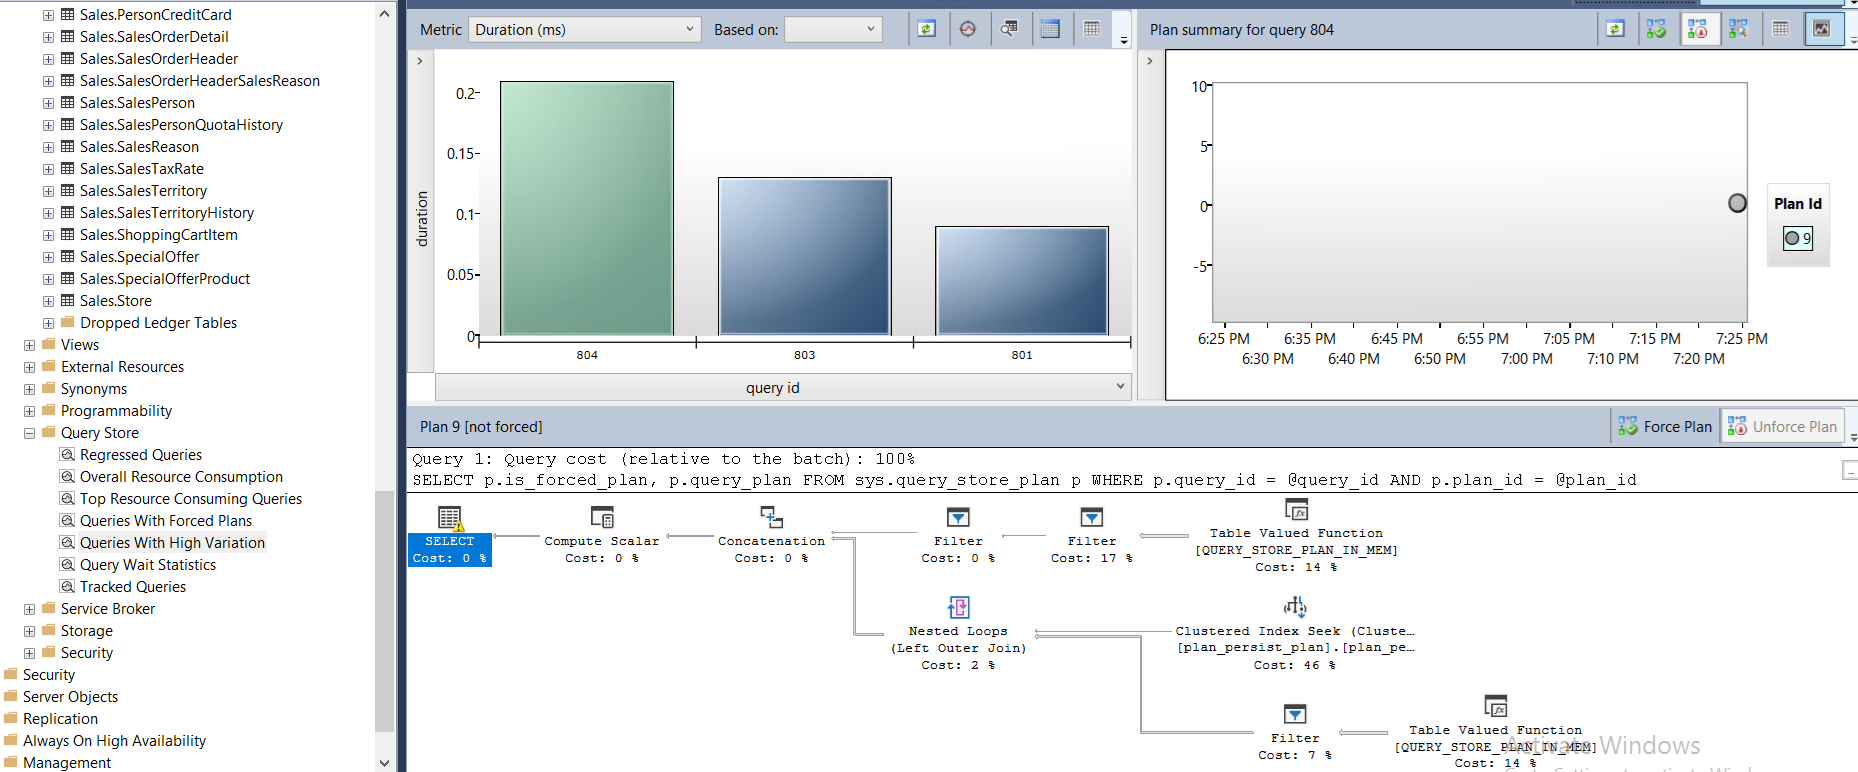
Diagram - 9: Top Resource Consuming Queries
Query Wait Statistics
Indicates wait statistics and identify queries that might be slow down the database.
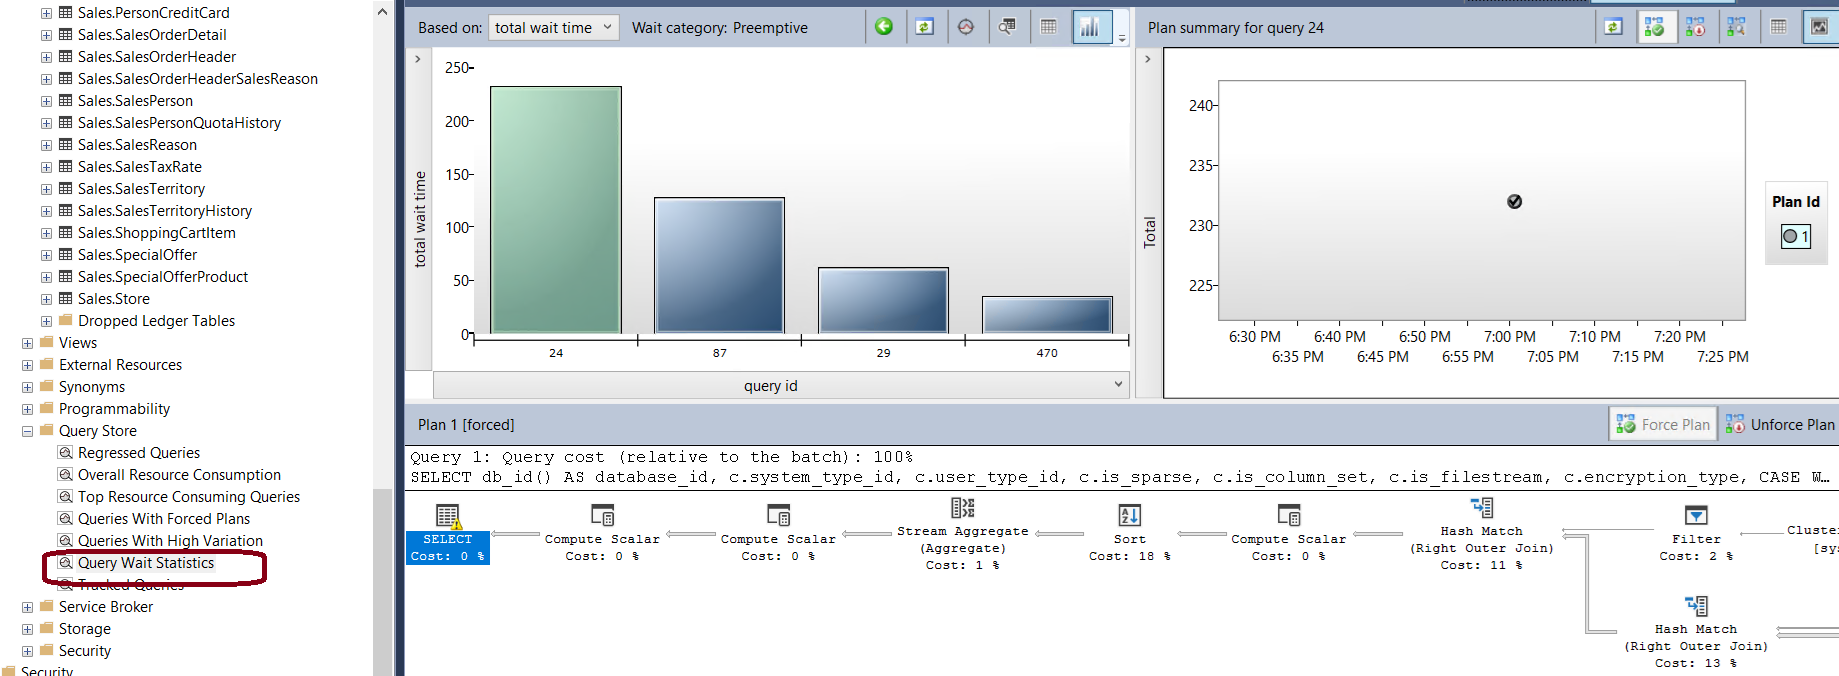
Diagram - 10: Query Wait Statistics
Tracked Queries
Monitors the most important queries in real time. Particularly useful in case you have queries with forced plans and you want check its stable performance.
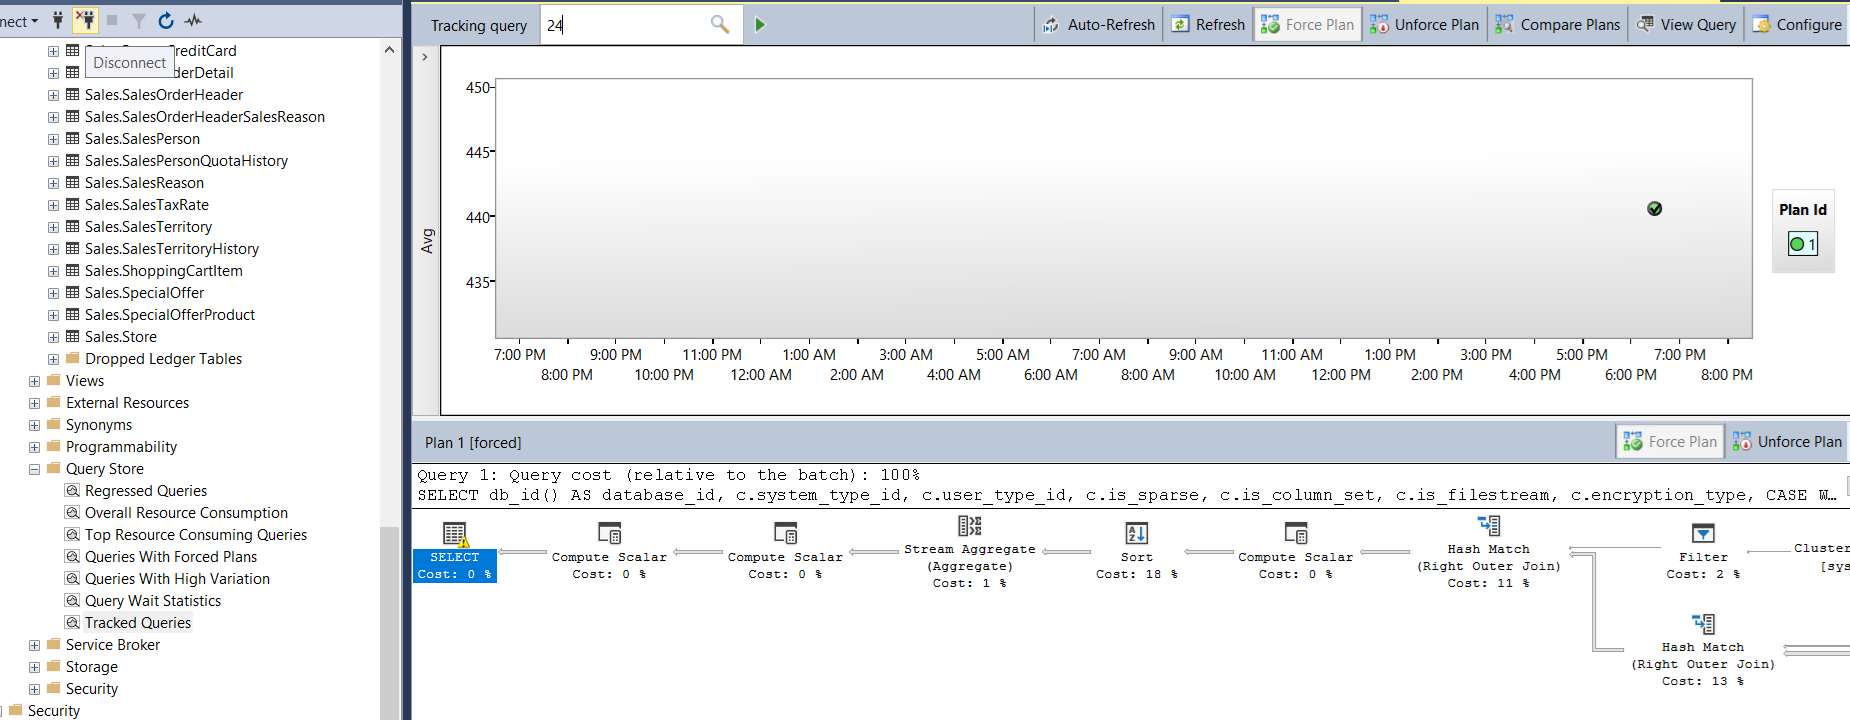
Diagram - 11: Tracked Queries
Best Practices
- SQL Server Management Studio - use the latest version
- Query Store Capture Mode - set it Auto to collect only relevant and actionable queries.
- Collecting data continuously - Query Store may change the operation mode silently. Monitor that Operation Mode is set to Read Write.
- Keeping the most relevant data - set time-based policy as auto cleanup, Query Store Capture Mode as Auto and size-based policy as cleanup.
- Query Store maximum size - adjust it based on database workload, size, unique ad hoc queries and disk space
Last words
Query Store is a powerful tool for monitoring and optimizing query performance. By using its insights, you can maintain a healthy, high-performing SQL Server environment and quickly address potential issues before they impact users.