As a DBA your job is to keep an eye on your SQL Server's performance, health, and potential issues. Though SQL Server has some built-in tools and commands, but you will not get any consolidate view or resolution from them. With your tight budget, most of the time you cannot afford the hefty pricey commercial monitoring tools. Fortunately DBADash, a free, open-source monitoring tool designed by David Wiseman to help DBAs track SQL Server metrics efficiently without breaking the budget.
Whether you are managing a single server or an entire fleet, DBA Dash offers insightful dashboards, historical data collection, and alerting features that empower you to proactively maintain your database environment. In this article, we will explore what DBA Dash offers, how it works, and why it is worth considering for both personal projects and production environments.
How it Works
In DBADash ecosystem has four major components:
- Monitored Instances - SQL Servers that need to monitor.
- DBA Dash Agent/ DBA Dash Service - Collects performance metrics directly from monitored instances. It can also pull information from S3 buckets.
- Repository DB - DBA Dash Agent dumps metrics here.
- DBA Dash GUI - Dashboard where you can watch all the consolidated metrics together.
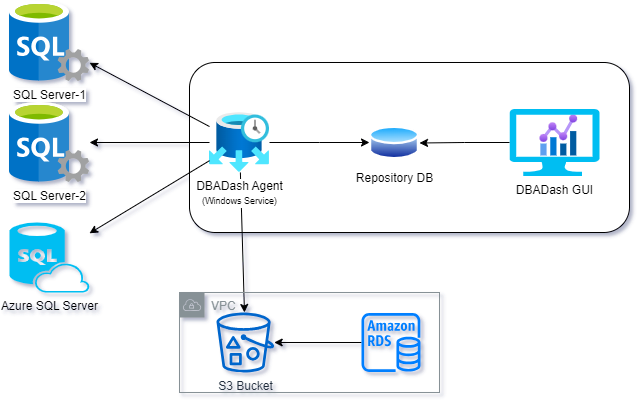
Figure-1: DBA Dash Data Collections
Setting up the Battle Ground
Prerequisites
- Monitored Instances - SQL 2005-2022, including Azure DB and RDS (SQL Server)
- Repository DB - SQL 2016 SP1 or later, including Azure DB and RDS (SQL Server)
- DBA Dash Service - .NET 8 Desktop Runtime. Version 8.0.0 or later
- Account to run the service with appropriate permissions to connect to the monitored instances and repository database instance
Installation
- Download the latest DBADash_{version}.zip version from github.
- Extract the files to your preferred location.
- Run DBADashServiceConfigTool.exe
- Set a destination connection where repository database will be created and metrics data will be stored.
- Click the "Source" tab
- Click the connect button to add a source connection (monitored instance)
- Review the options available on the "Extended Events" and "Other" tab.
- Click "Add/Update" to add the source connection(s)
- Repeat the process of adding source connections as necessary
- Click "Save"
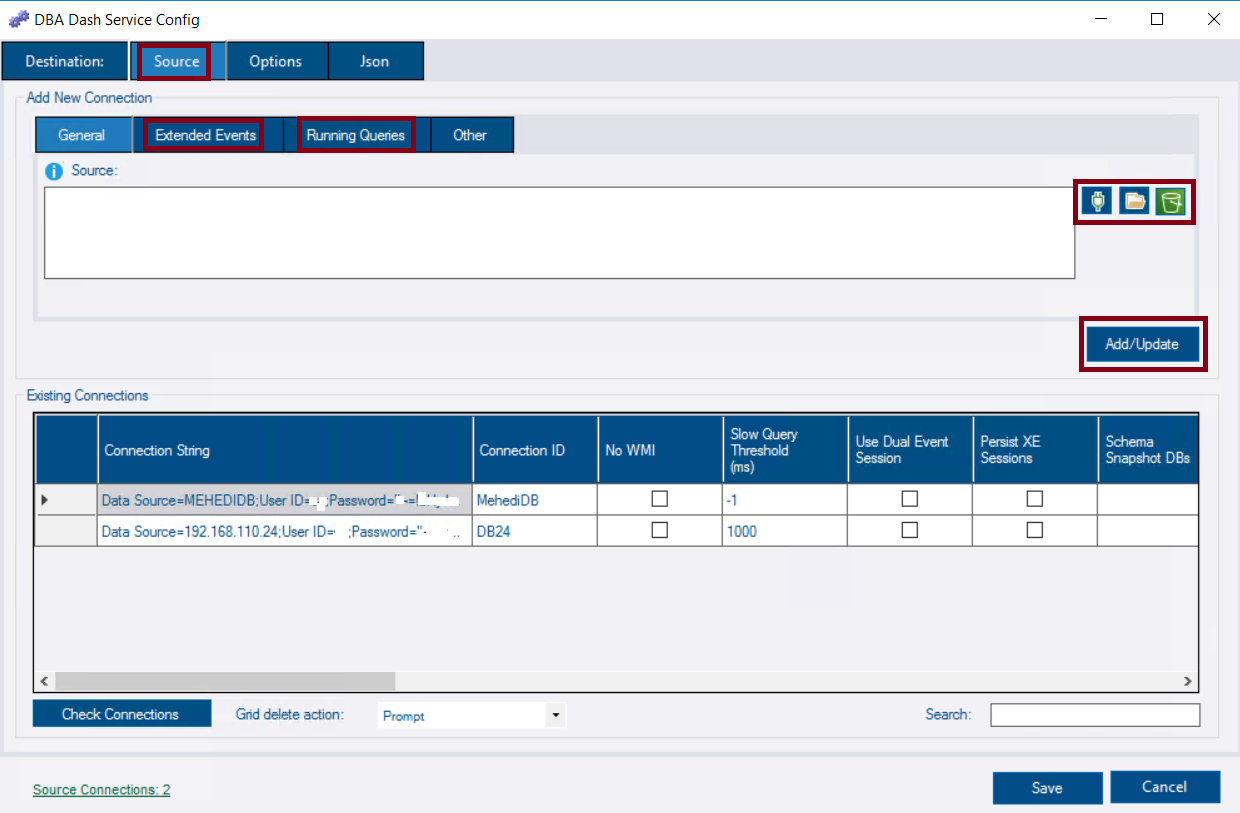
Figure-2: DBA Dash Service Configuration for Monitored Instances
- Click the "Destination" tab
- Click the "Install as service button"
- Click Install and enter credentials for the service.
- Click Start
- Click the "View Service Log" to check Info/Error log.
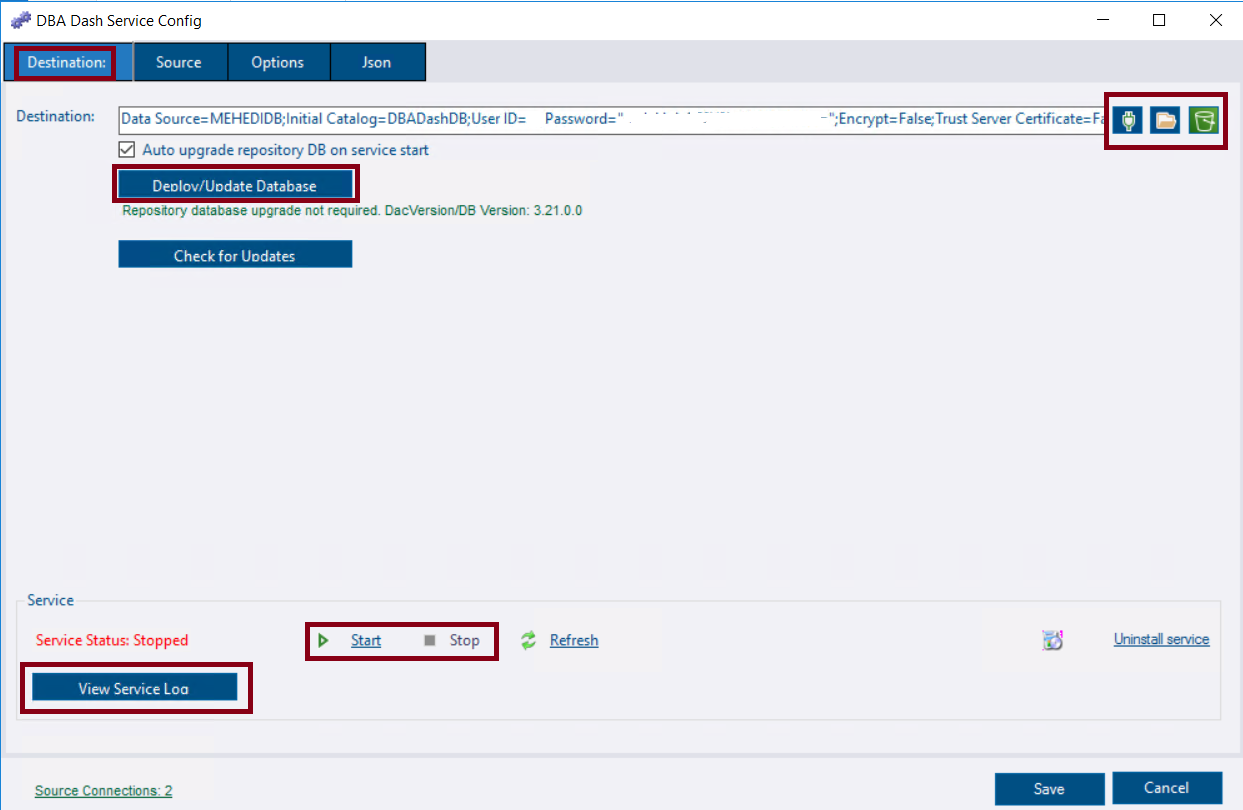
Figure-3: DBA Dash Service Configuration for Destination/Repository Database
DBA Dash GUI
Now run DBADash.exe to see the collected data. You will land to Home where you will see metrics from all monitored instances.
There are five tabs in Home section.
Summary
It Shows a dash board of all critical events with counts in upper section and all individual monitored instances' status in bottom. For example, you will see Agent Jobs, Backup status, Corruption, Database state, DBA Dash error, Disk space, Identity columns, Instance uptime, Agent Running status, Check DB status, Log Space, Memory Dump, Query Store info, Snapshot age and SQL Agent Alerts information here. Clicking on a item will navigate you to deeper of the issue.
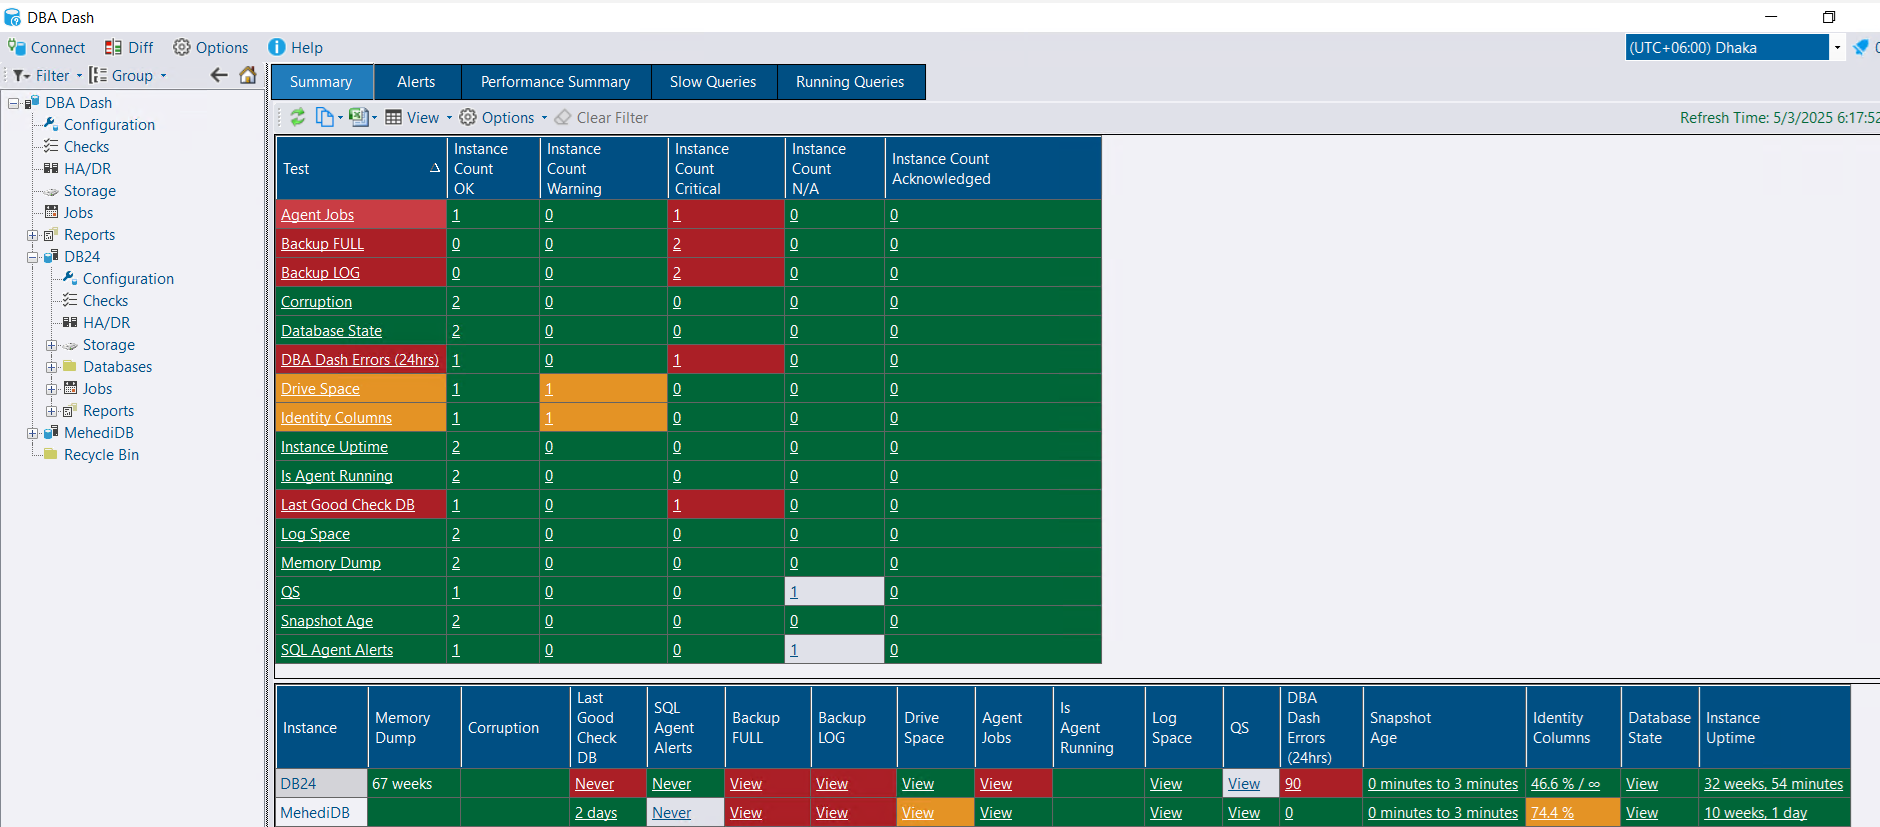
Figure-4: DBA Dash GUI Summary
Alert
This section displays any alert that you should be noticed.
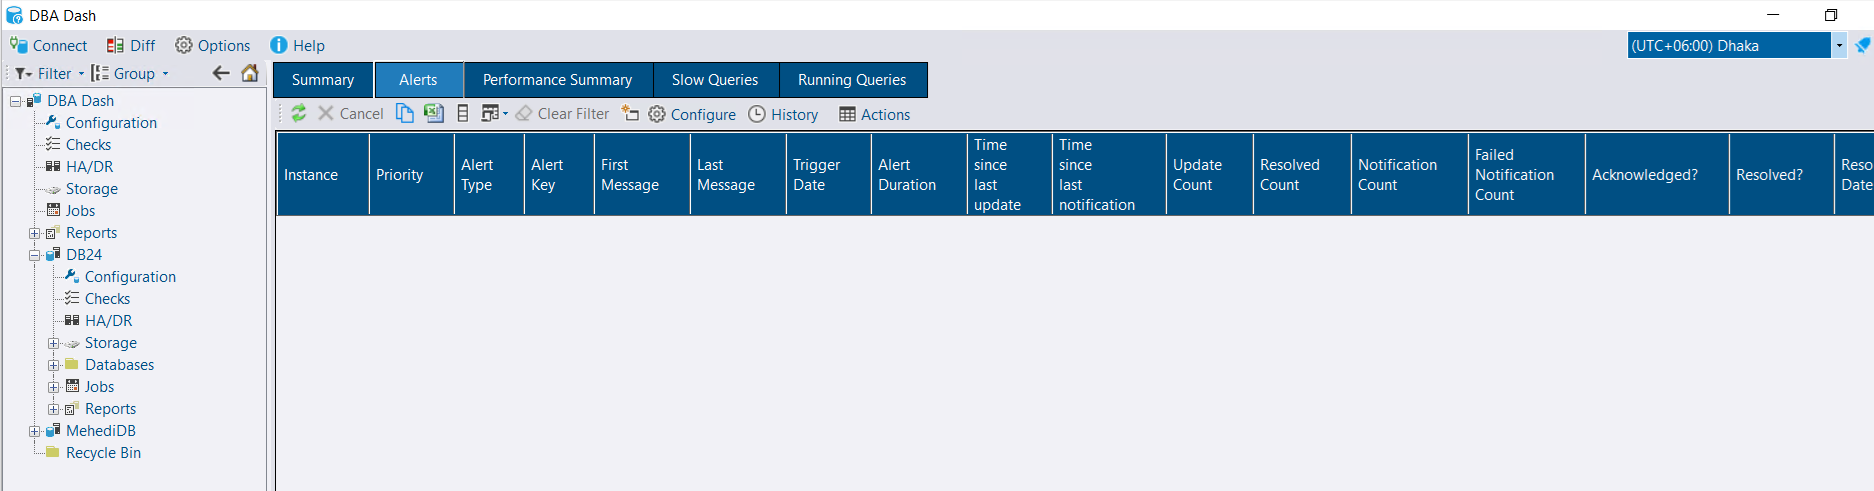
Figure-5: Alert
Performance Summary/Performance
Clicking on Performance Summary will take you to a new window with individual instances. It shows critical metrics for all of your SQL instances on a single page. You can customize it by adding your important metrics. Clicking further on instance name will drive you to Performance window. Here you will see:
- CPU usage
- Top Wait stats
- IO Performance
- Blocking and
- Object Execution status
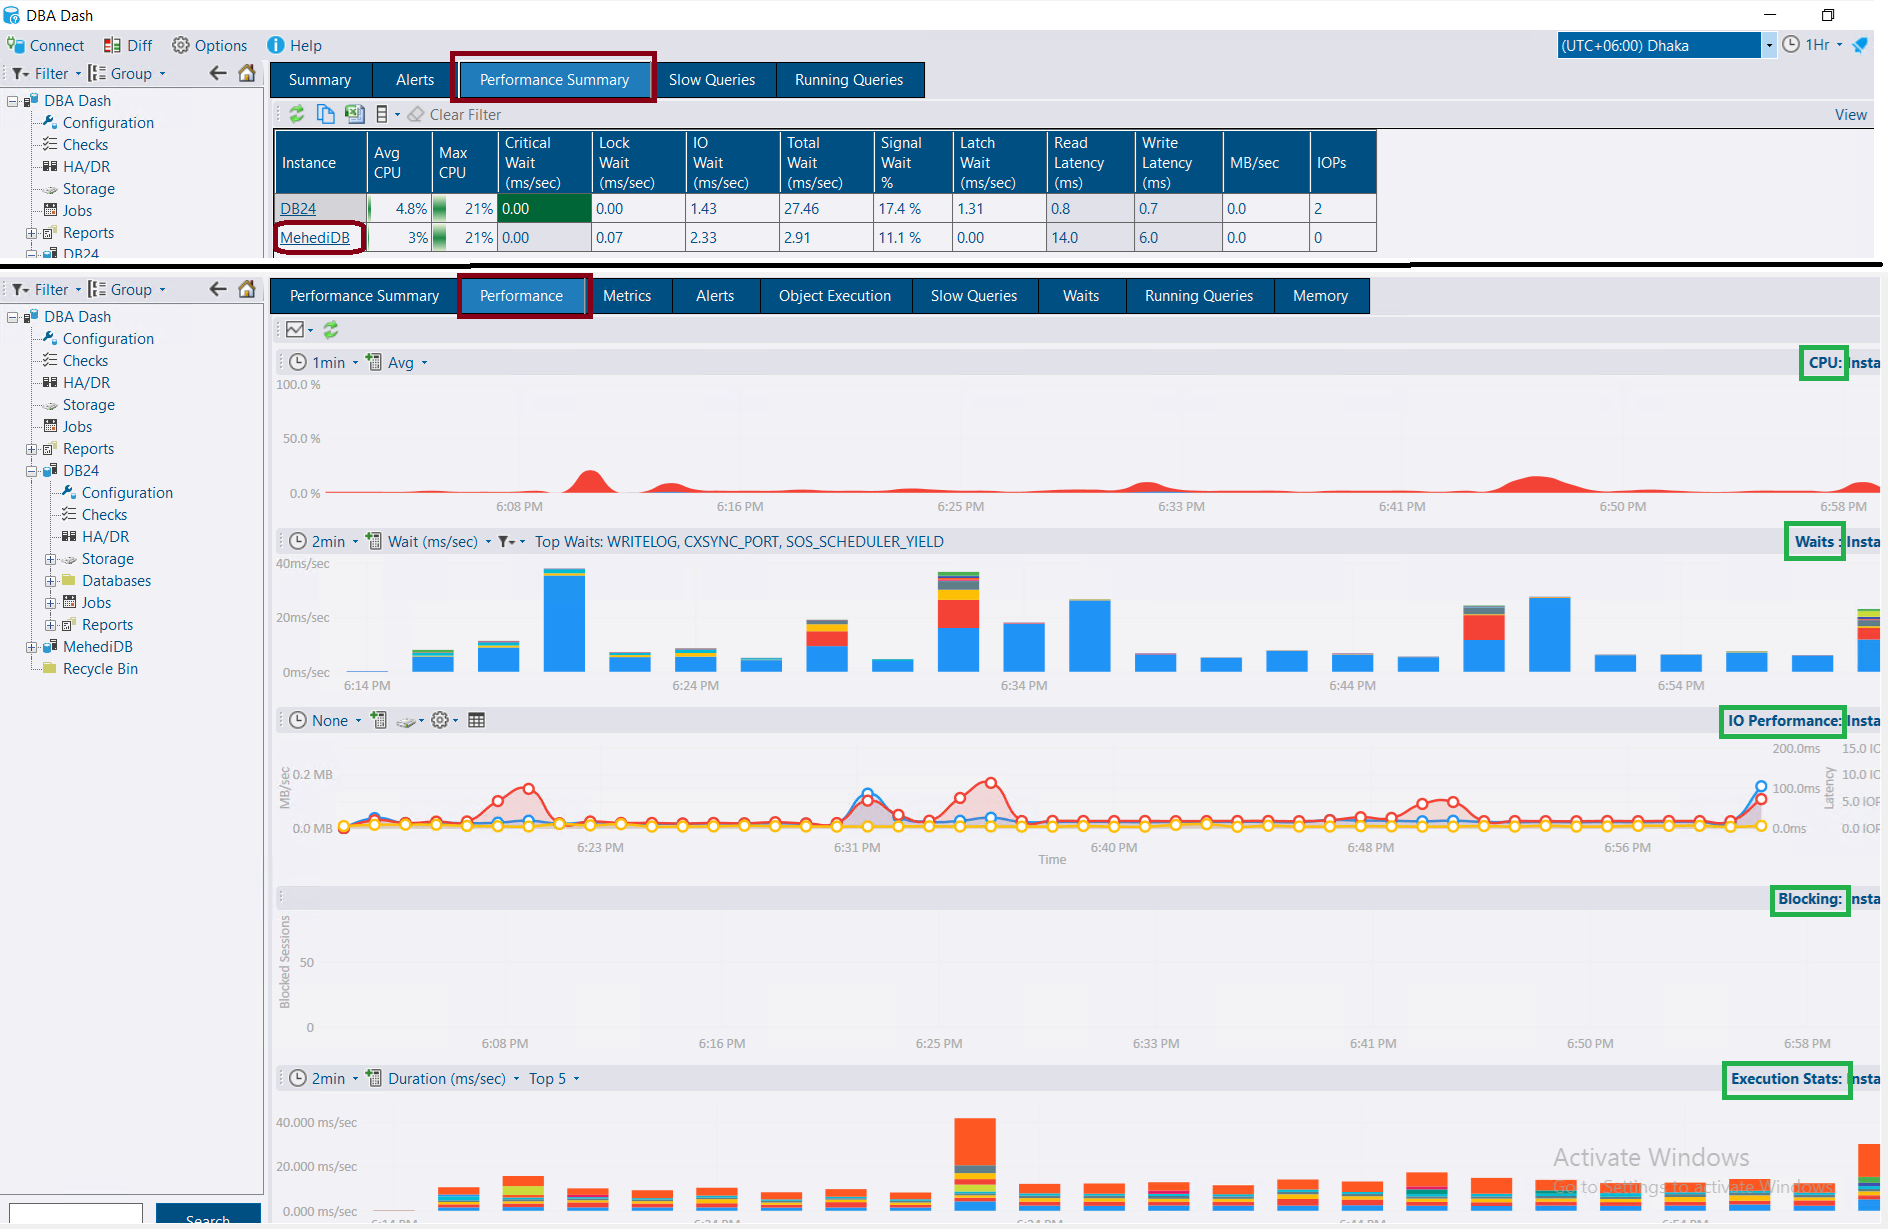
Figure-6: Performance Summary & Performance
Metrics
It shows different useful SQL Server and OS counters like number of deadlocks/sec, avg. wait time, lock wait time and lock waits/sec.
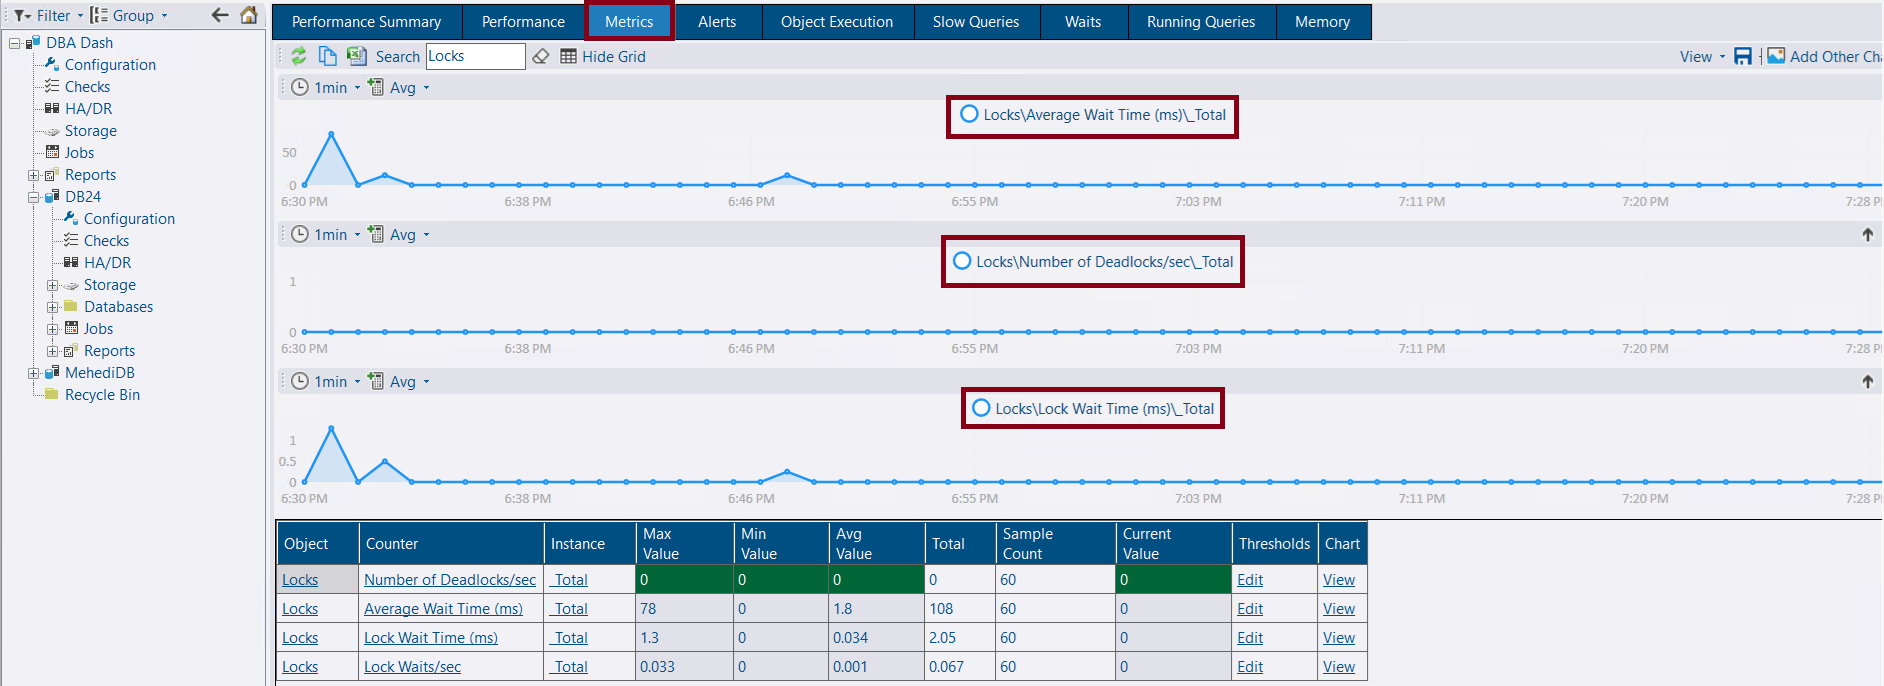
Figure-7: Performance Metrics
Object Execution
This window shows top stored procedures those are executing in your system over the period. You can track down which stored procedures are using the most CPU or IO, which are executed most frequently and which have the slowest execution times.
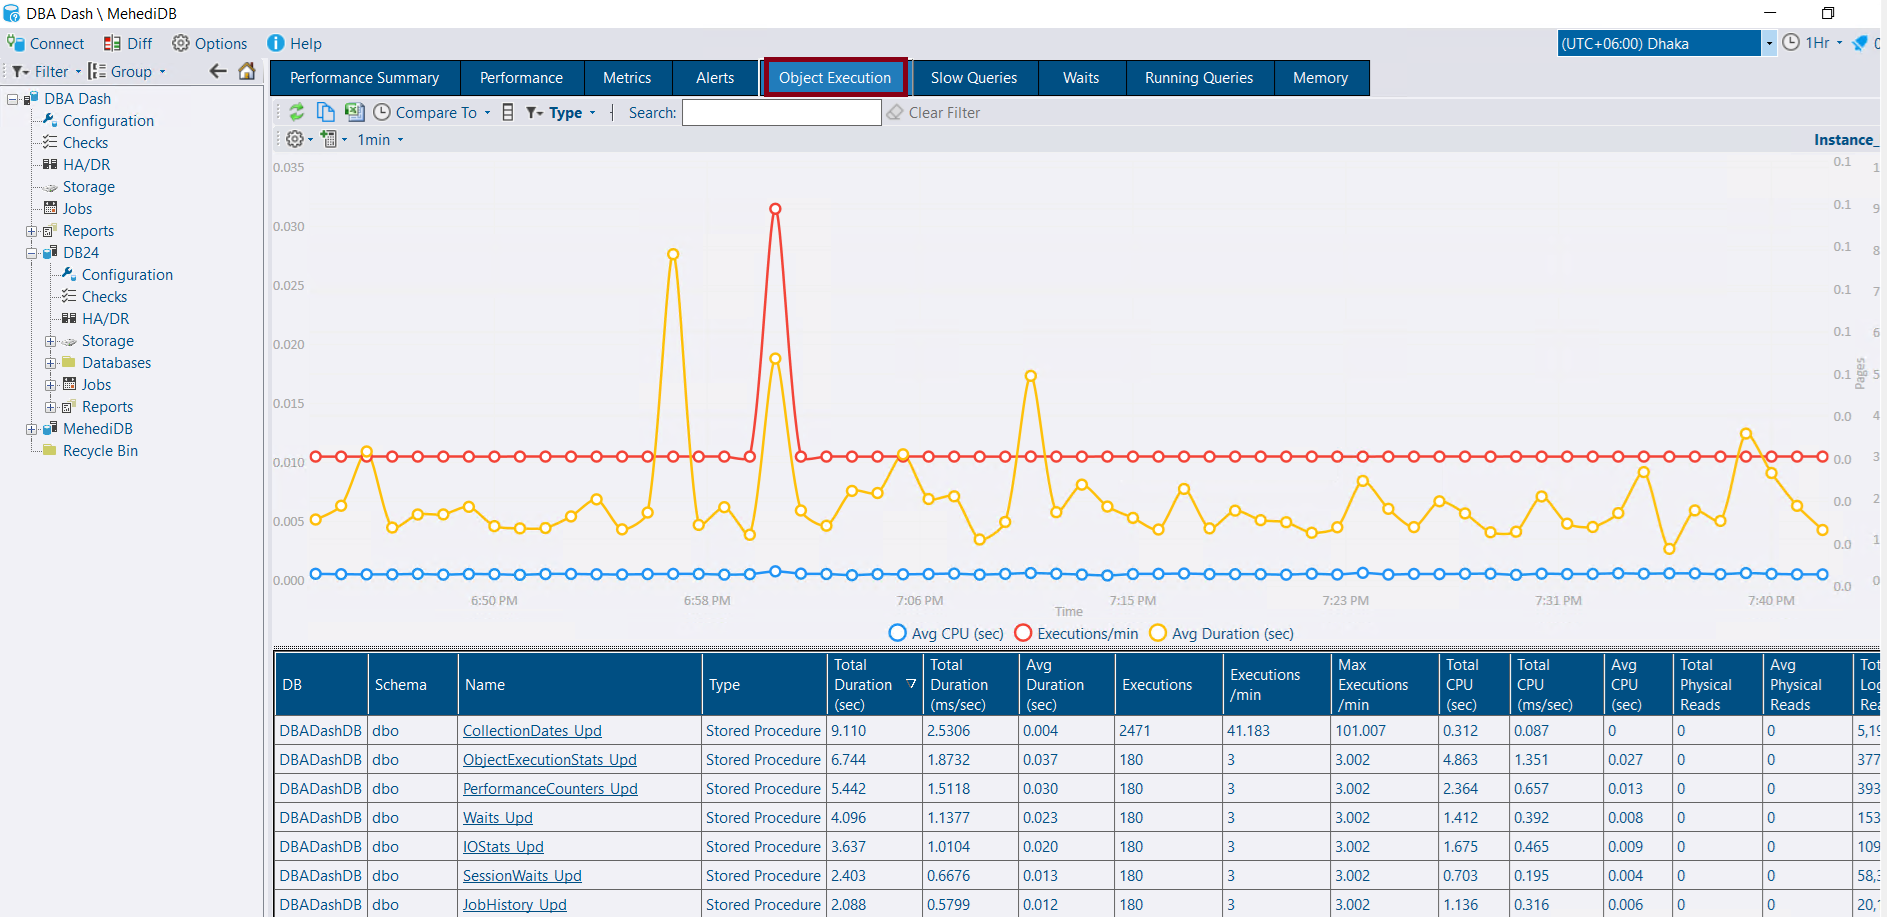
Figure-8: Object Execution
Clicking on individual stored procedure will navigate you to new window where you can compare your stored procedure performance with yesterday or last week to spot regressions early. So, you can quickly assess issues that need attention and measure the impact of any recent performance tuning.
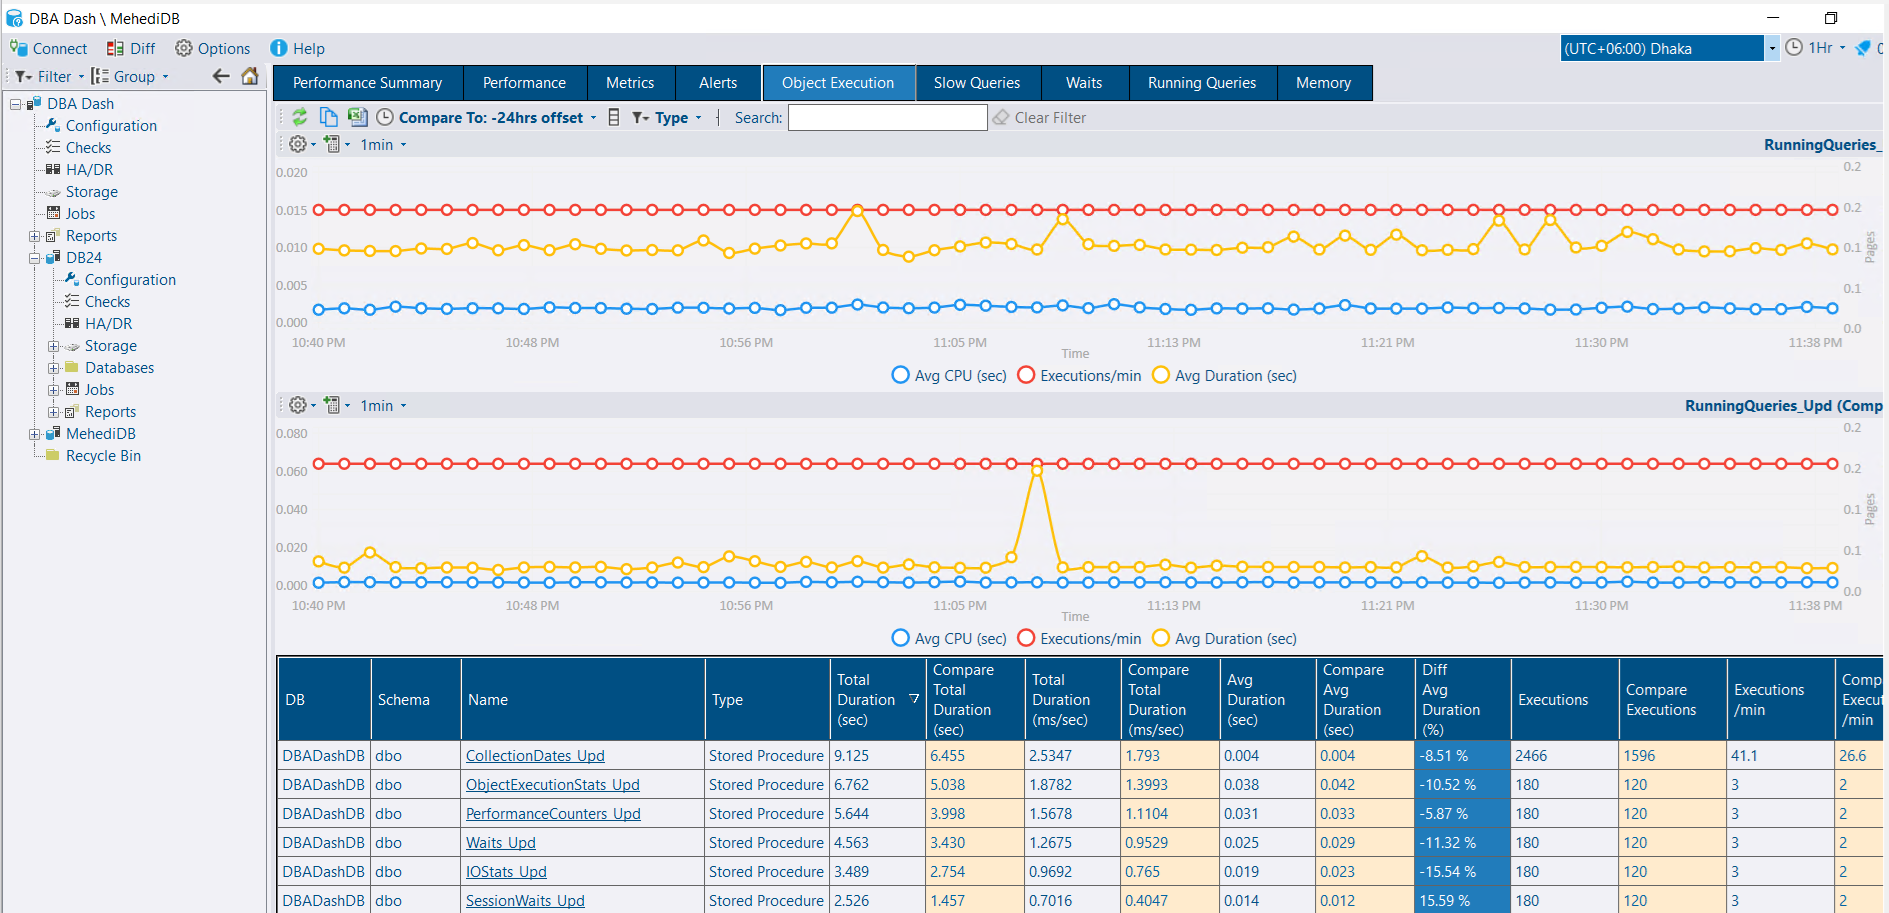
Figure-9: Object Execution Compare
Slow Queries
Slow queries are captured via Extended Events (rpc_completed and batch_completed). Filter and analyze by application, database, client, object name, result, and more. You can check the query text and parameters. It is linked with running queries data, so you can track exactly what the query was doing at different stages of execution. This insight helps you confidently answer why the query was slow—was it blocked? Did it use a poor execution plan? Which specific statement caused the issue?
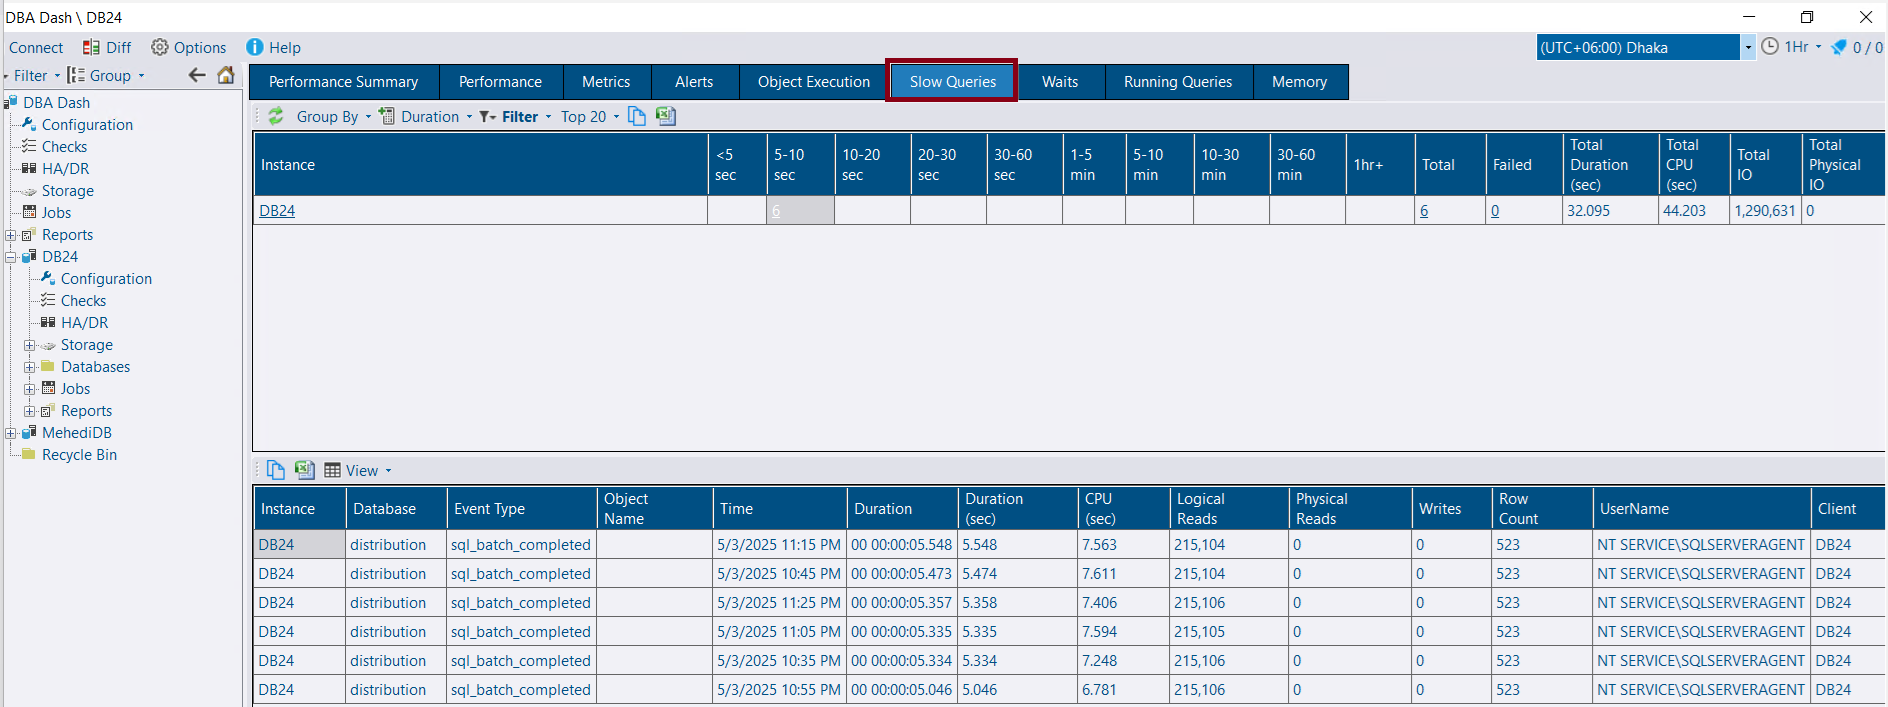
Figure-10: Slow Query
Waits
It shows top wait types of your SQL Server. Check why your SQL Server waiting for. Is it waiting CPU, IO, thread, memory or any other resources? You can track them over time.
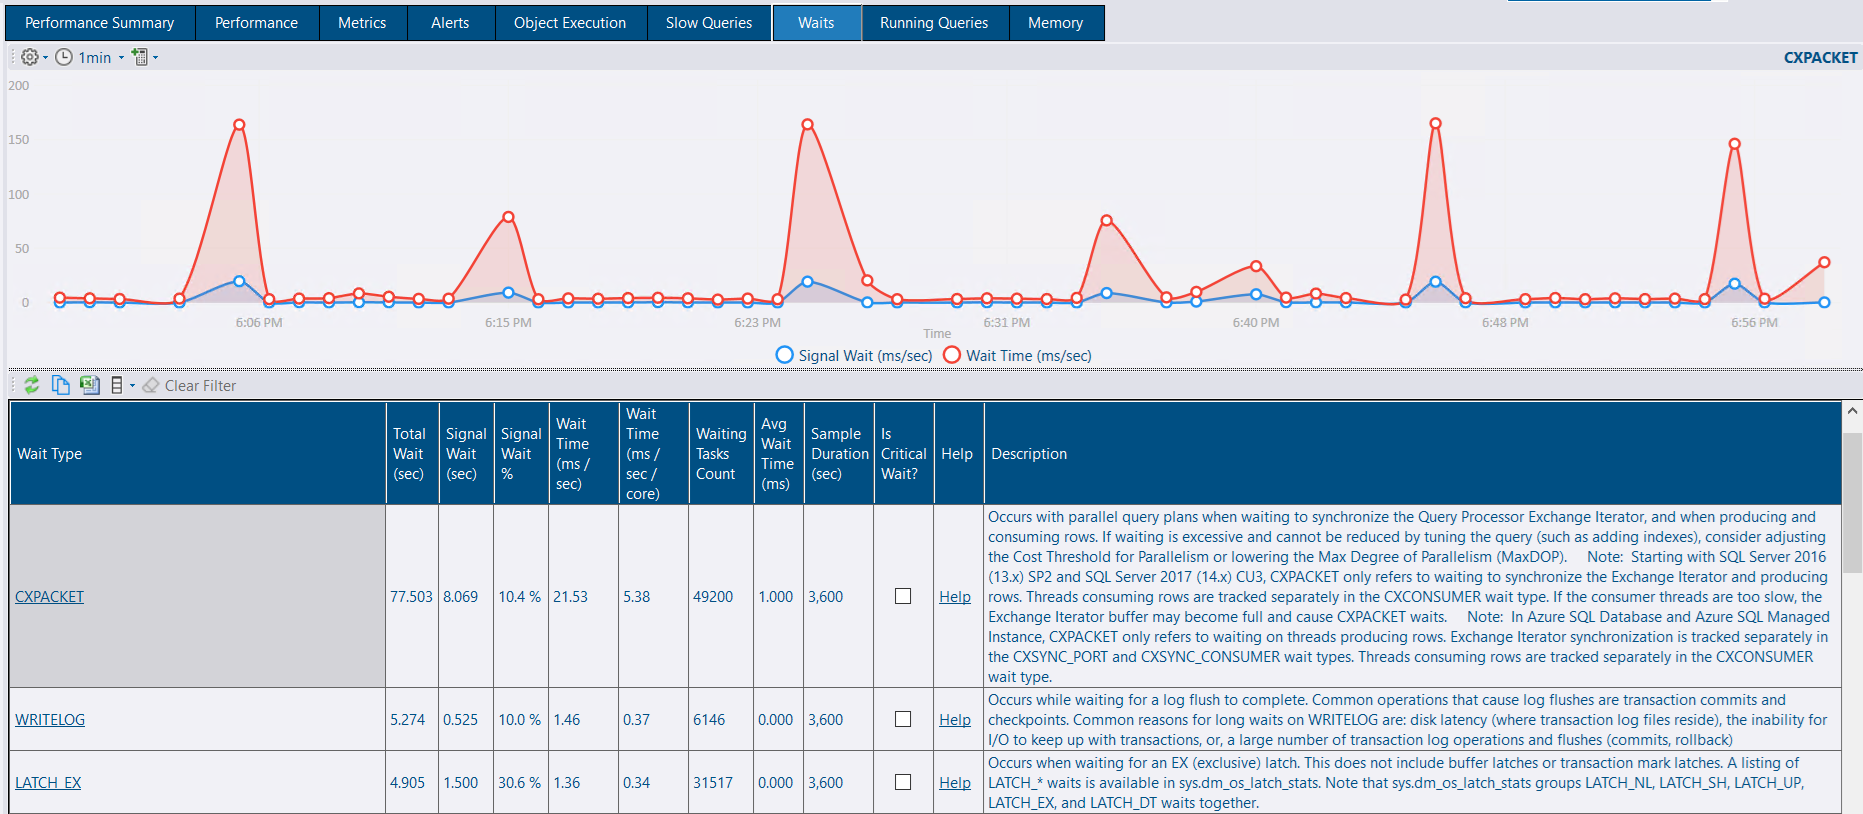
Figure-11: Wait types
Running Queries
This window will help you to:
- Check the running queries right now or any previous point of time.
- Identify the blocking chains and root blockers.
- See execution plans, query text.
- View wait resources, identify tempdb contention.
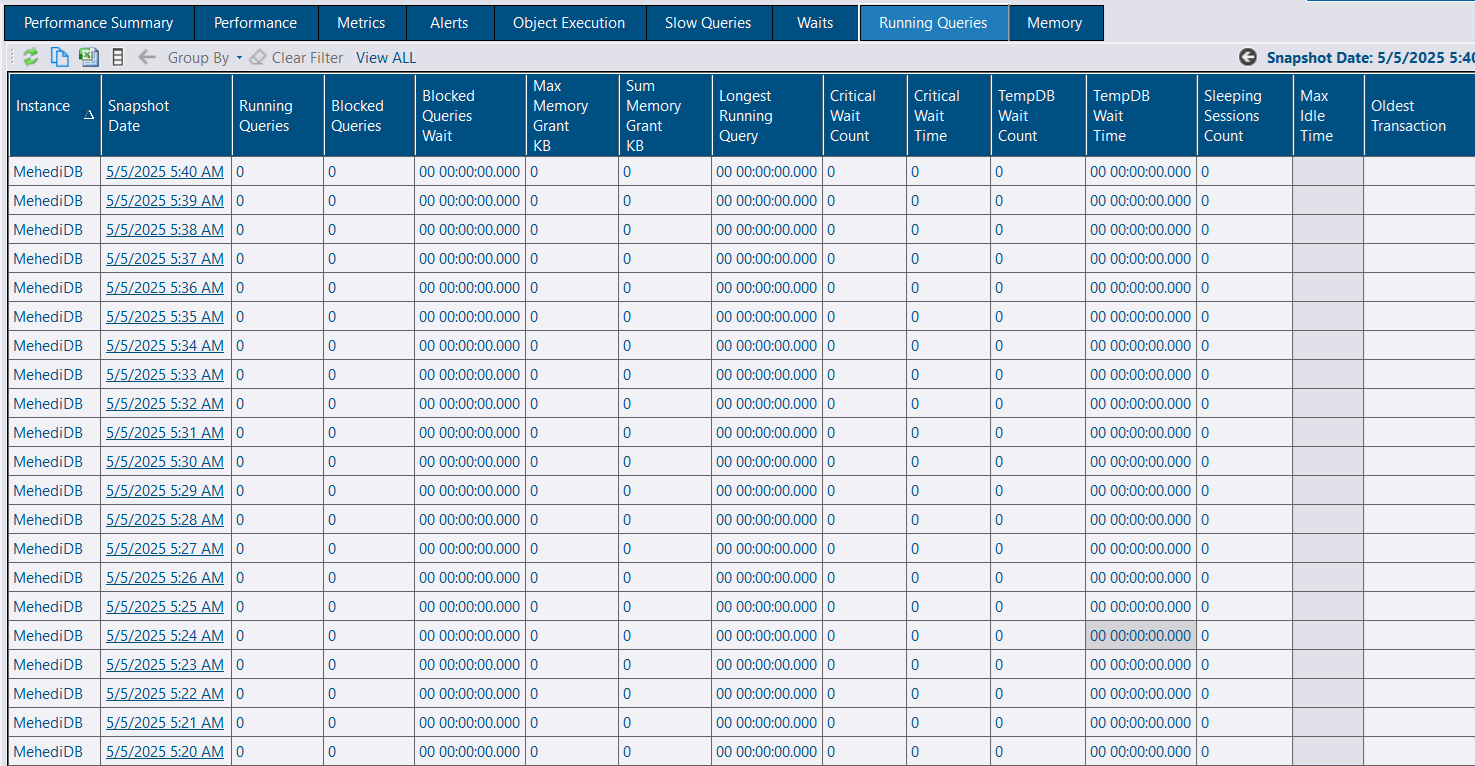
Figure-12: Running Queries
Memory
You can watch memory related performance under this tab. Check how memories were allocated to different internal parts and how memory clerks were using them over the period.
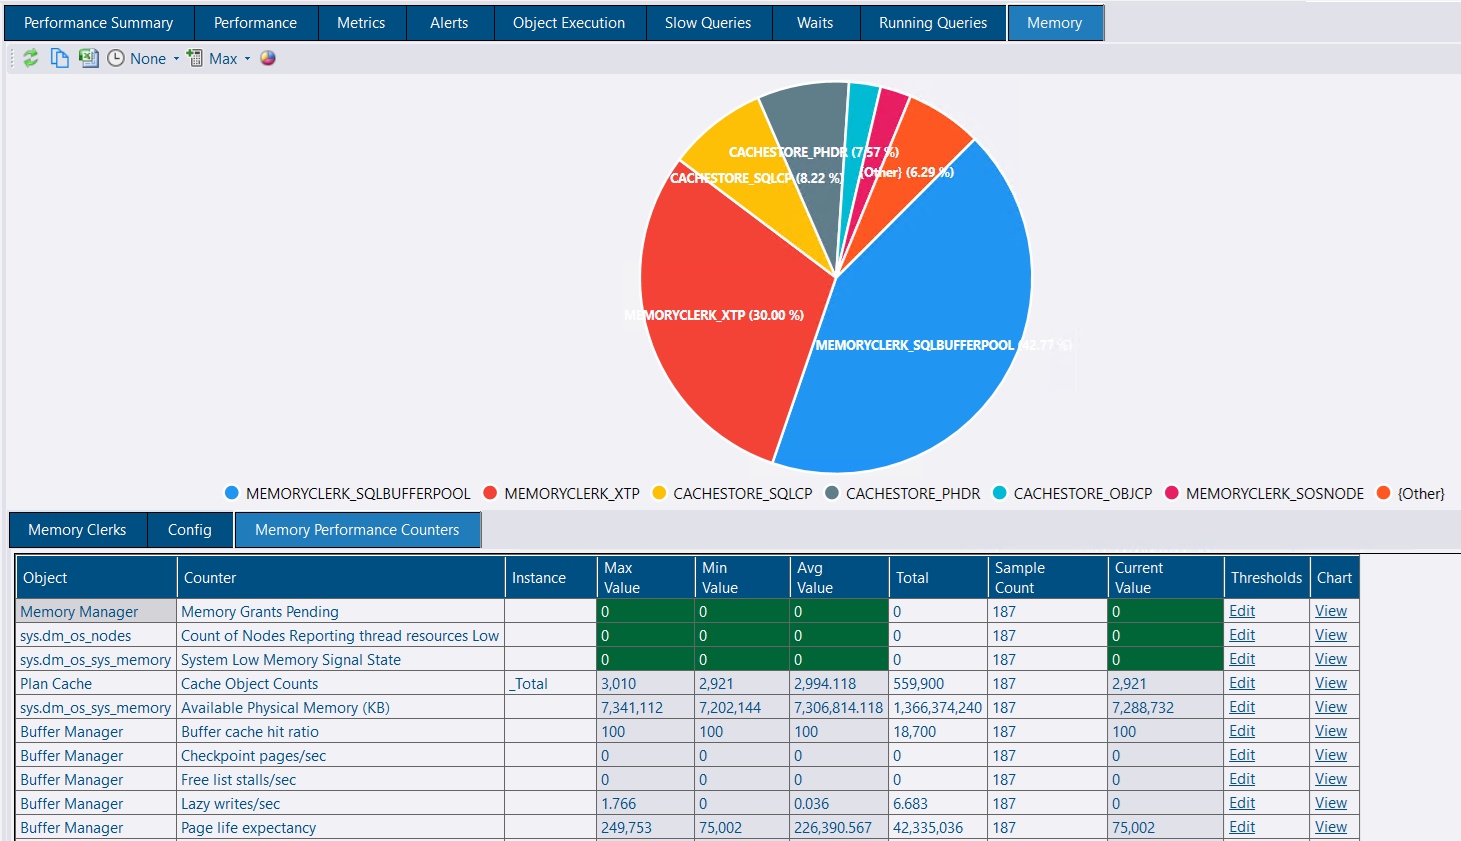
Figure-13: Memory
SQL Server Agent Jobs
You can monitor your agent jobs from this section. How they are performing, running frequency and execution duration. This will help you to find our any abnormality over the time.
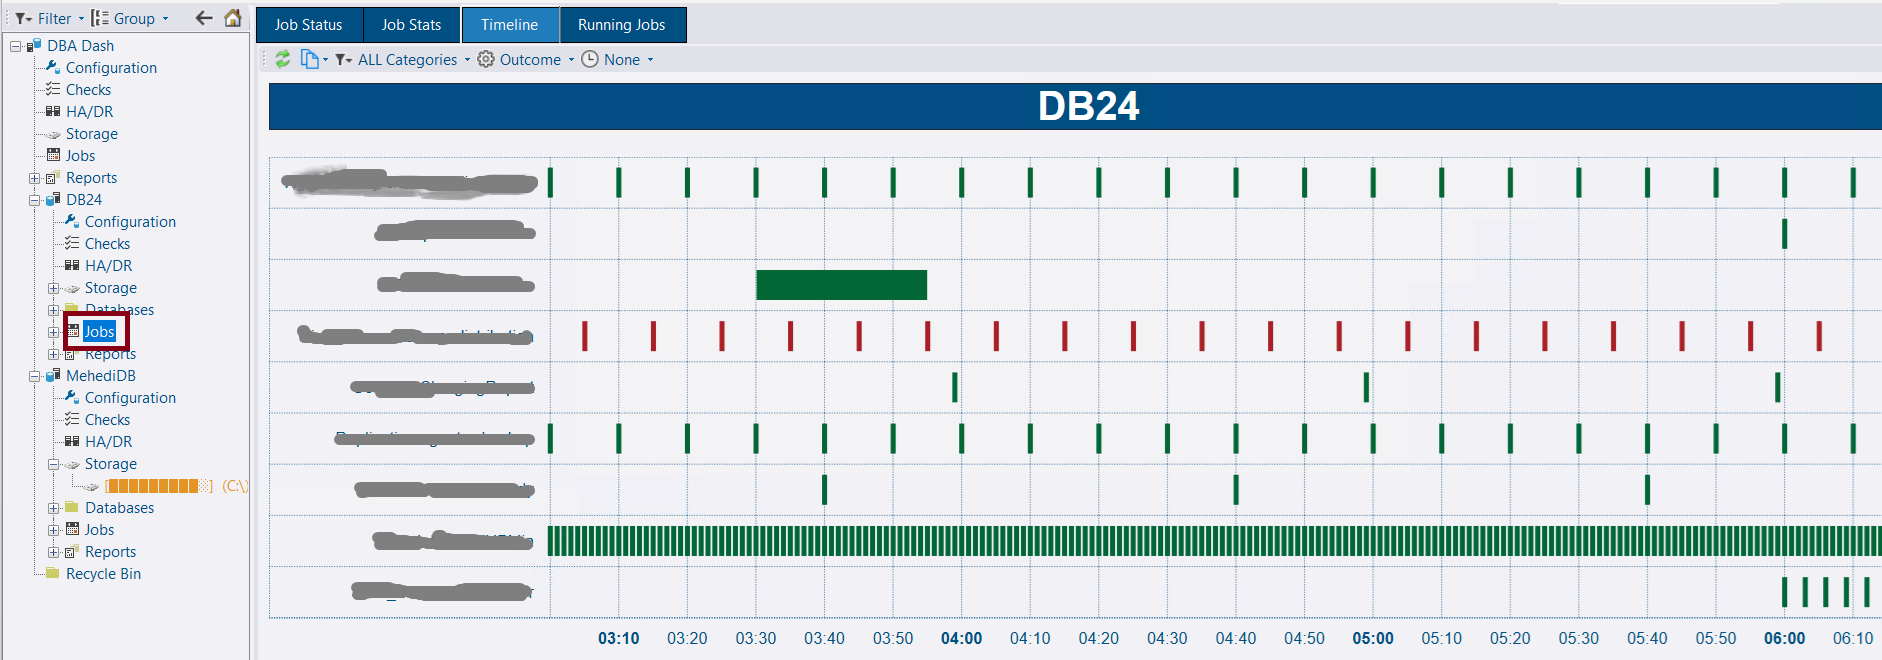
Figure-14: Jobs
Drives
You can monitor your disk utilization summary from this window.
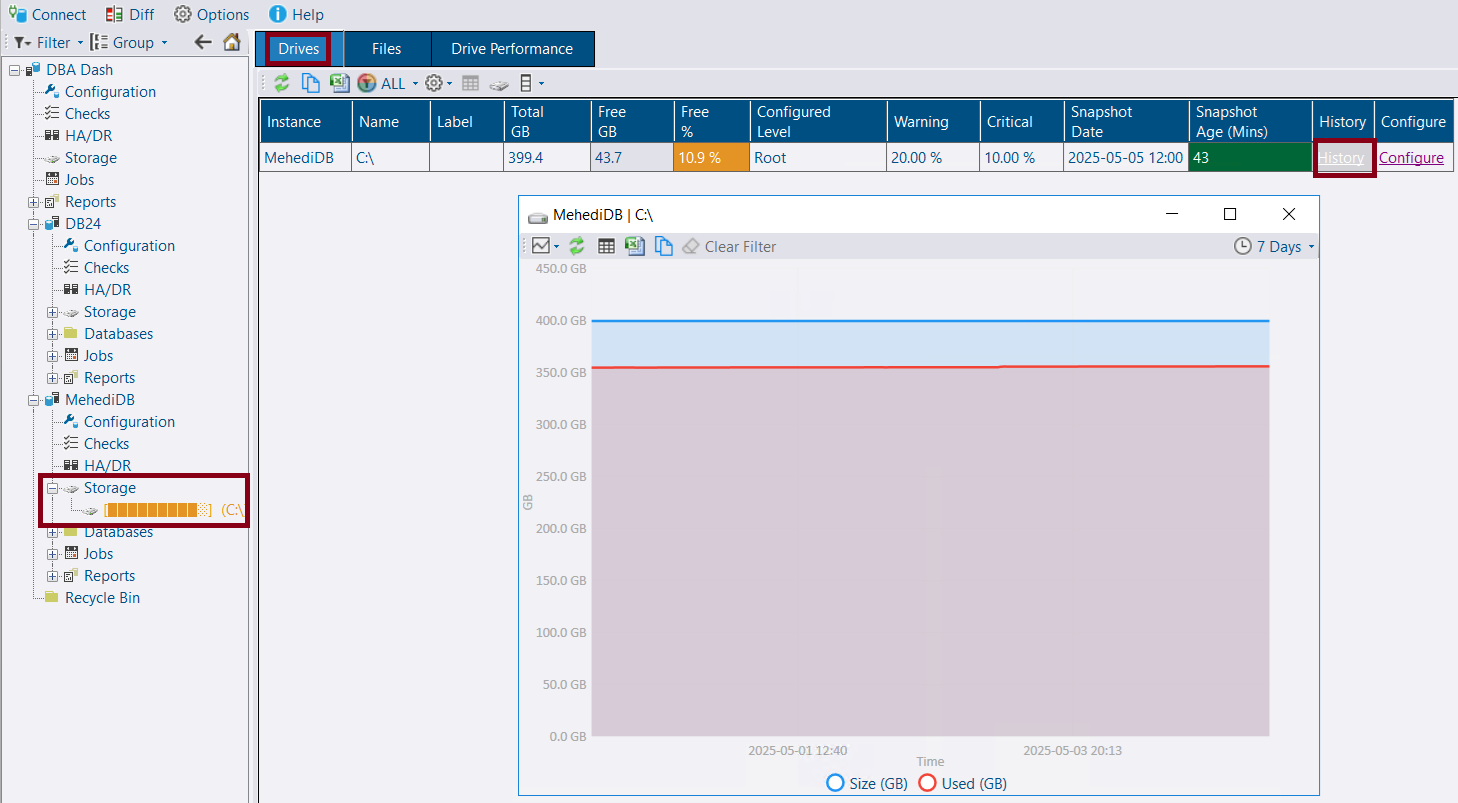
Figure-15: Storage Summary
DB Space
Check the size of all databases, allocated space, used space and their growth over the period. Even their is pie chart for graphical view.
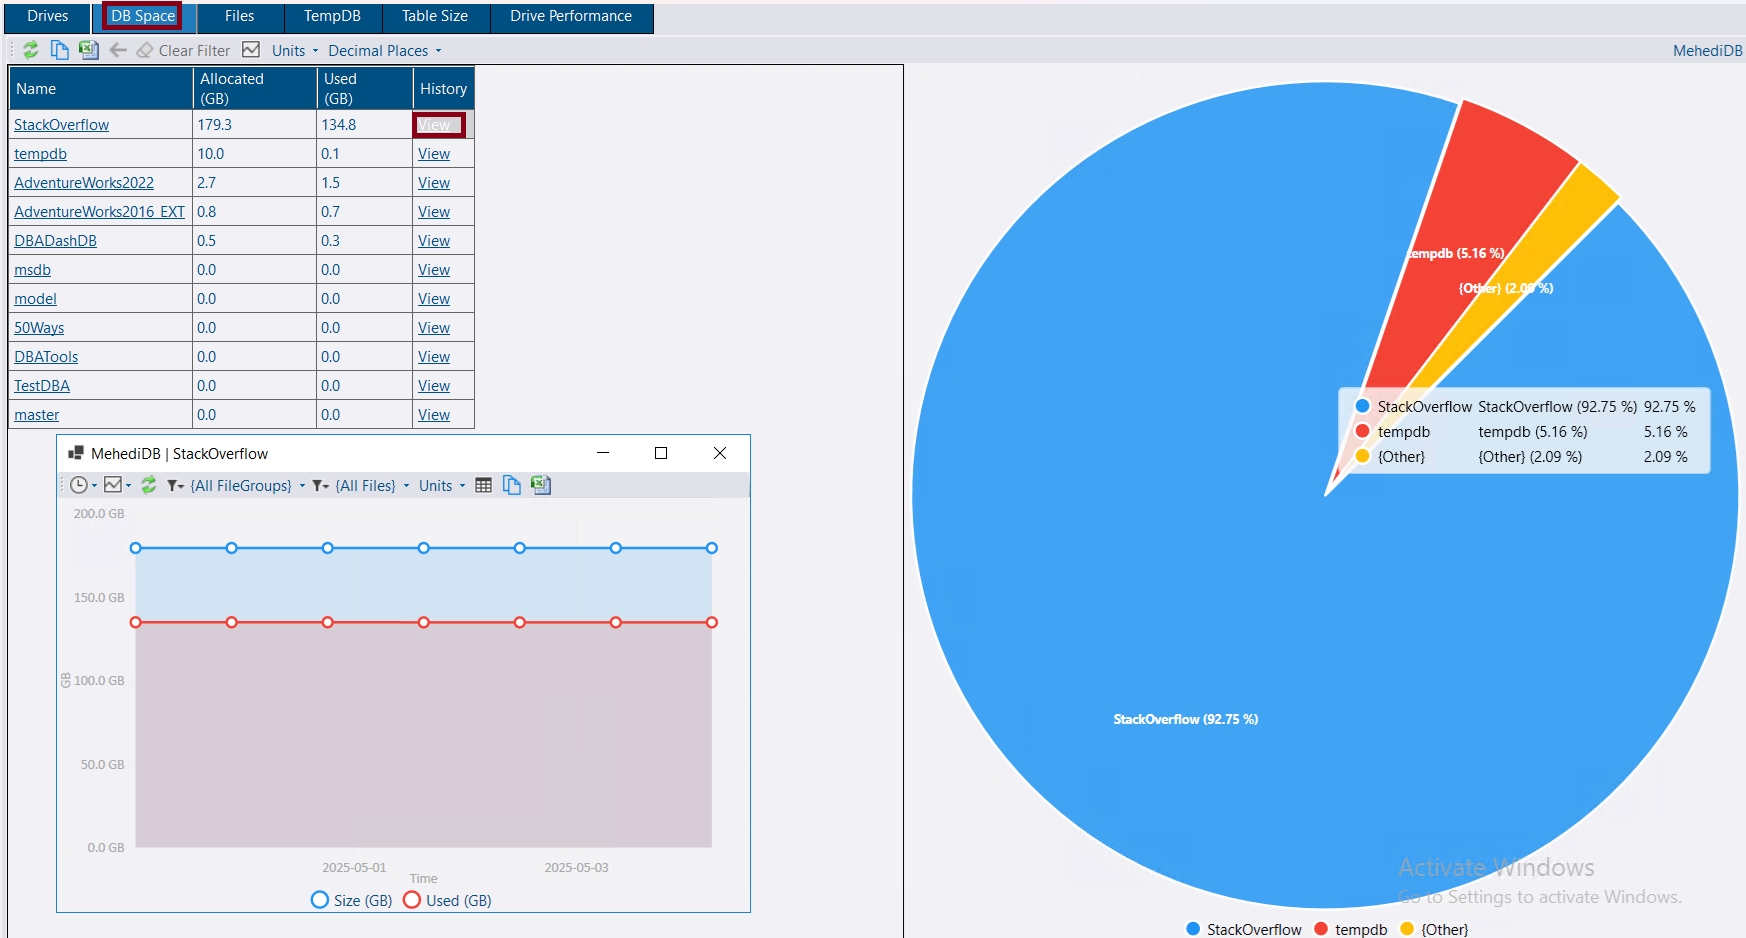
Figure-16: Database Size
Files
You can track down the mdf and ldf files as file group level with their size, used space, %free space and more info.
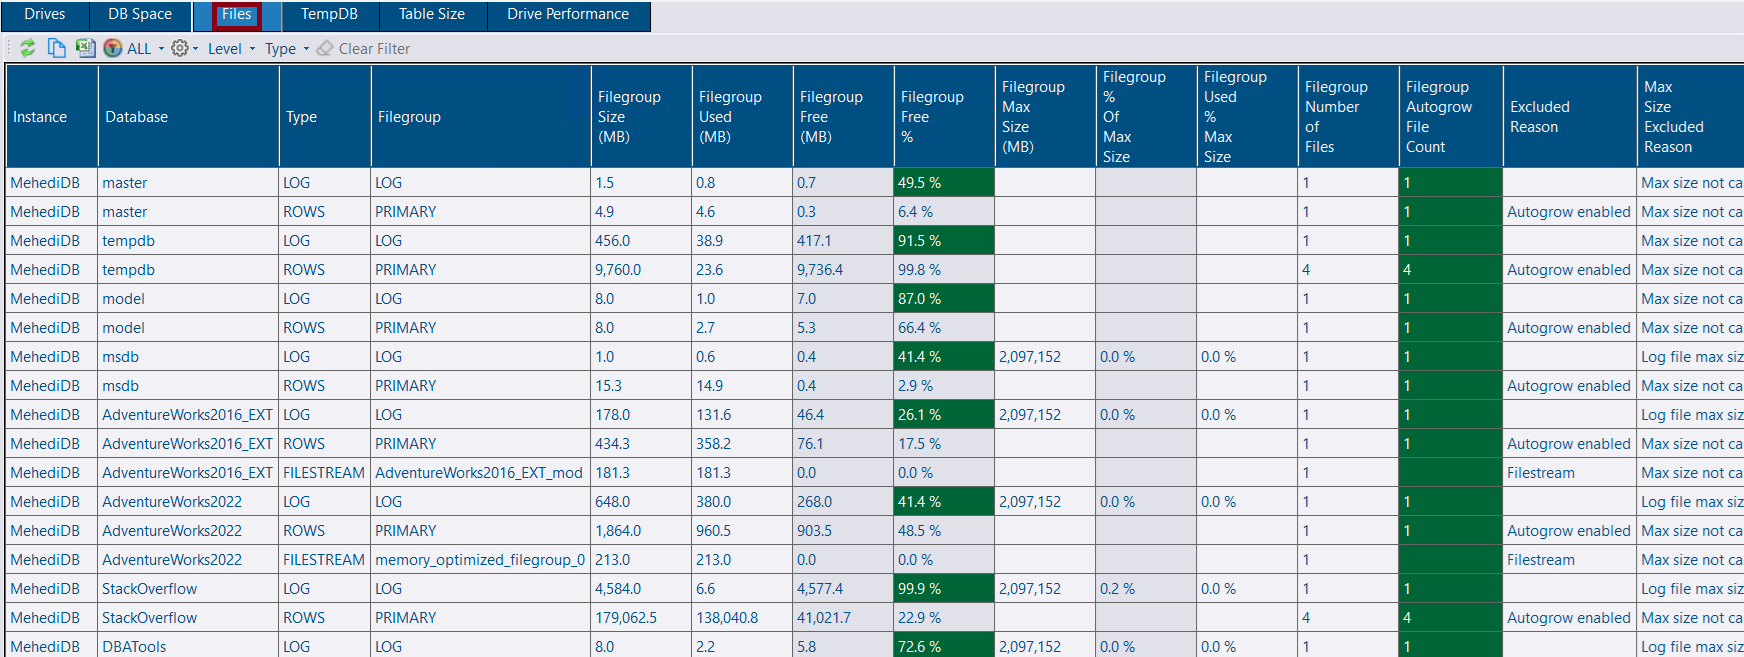
Figure-17: Filegroup Summary
tempdb
tempdb's summary info is shown here. You can view your tempdb health easily.
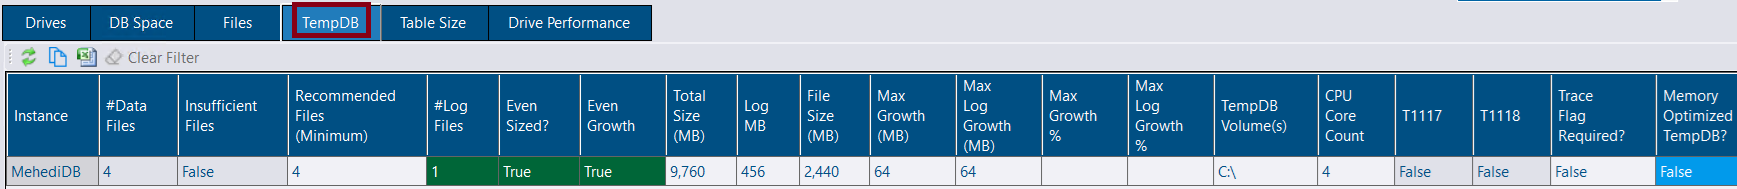
Figure-18: tempdb Summary
Drive Performance
Track down your drive latency, throughput and IOPS from here.
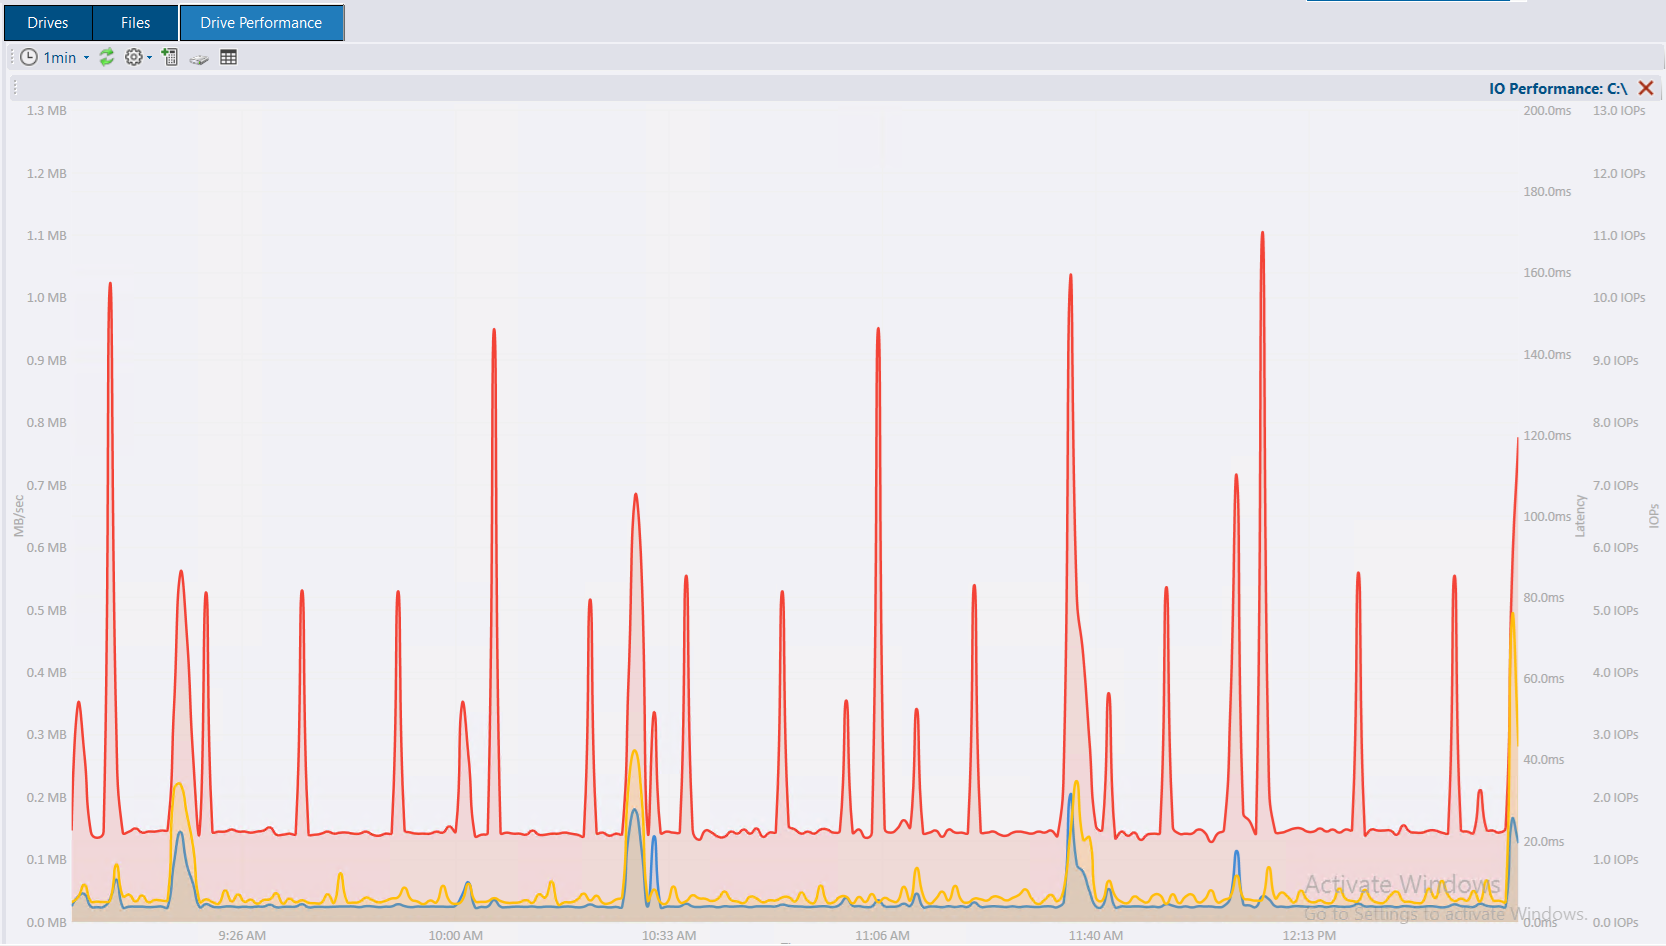
Figure-19: Drive Performance
HA/DR
Under this tab, you can track down Database backup, Log shipping, Mirroring and Availability group.
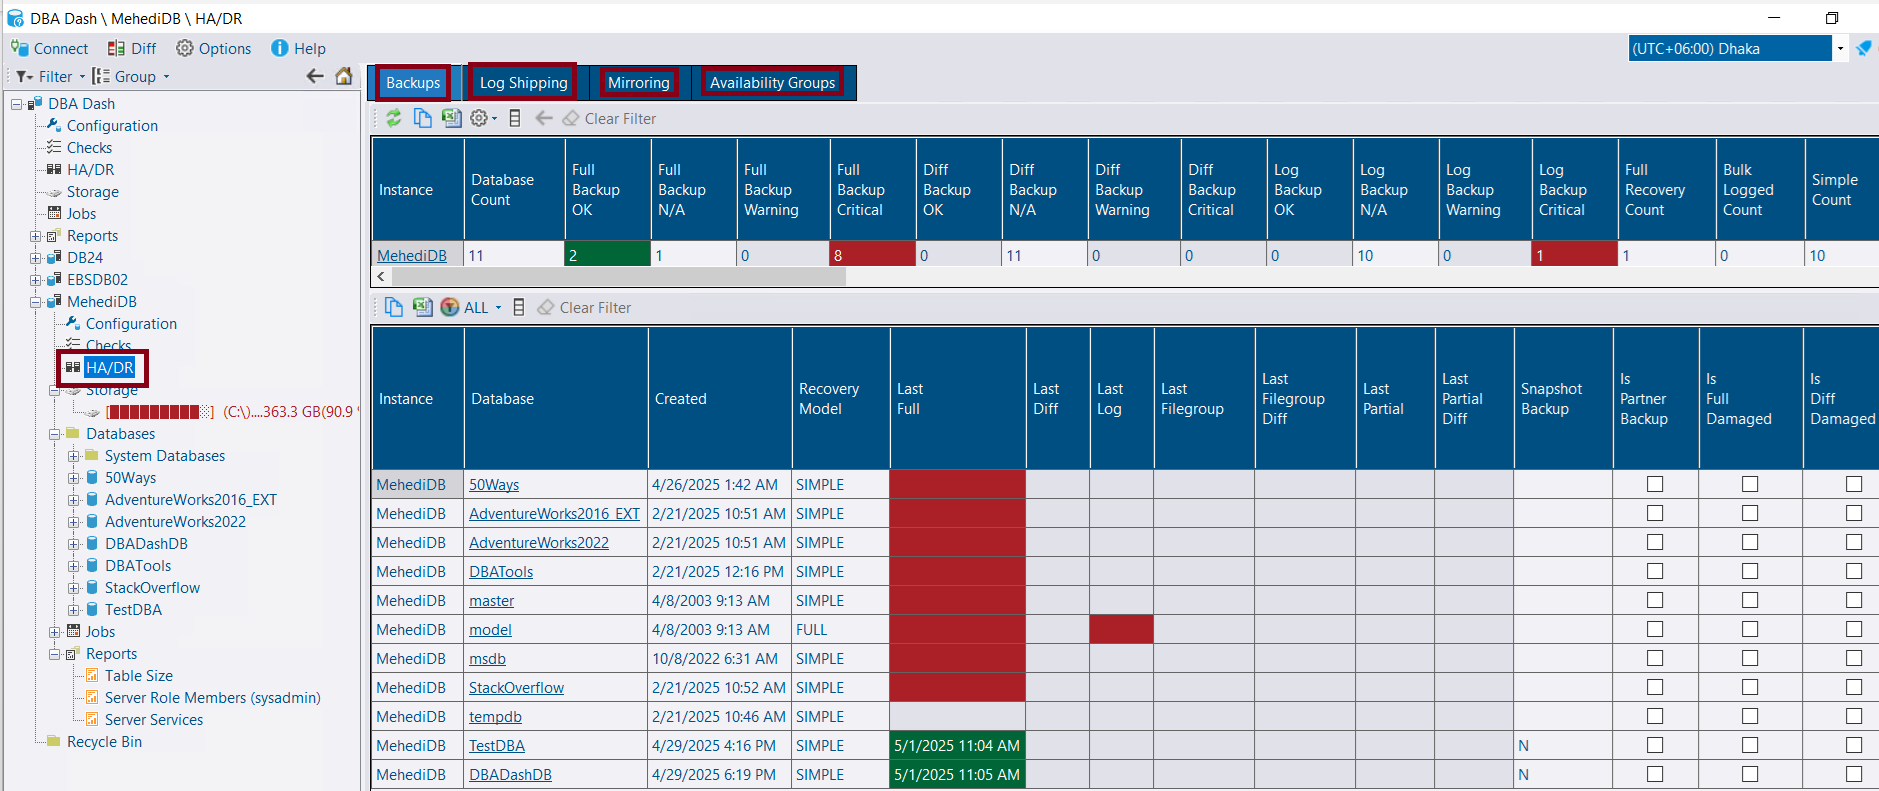
Figure-20: HA/DR monitoring
Server Role Members
Server role memberships are grouped in this menu.
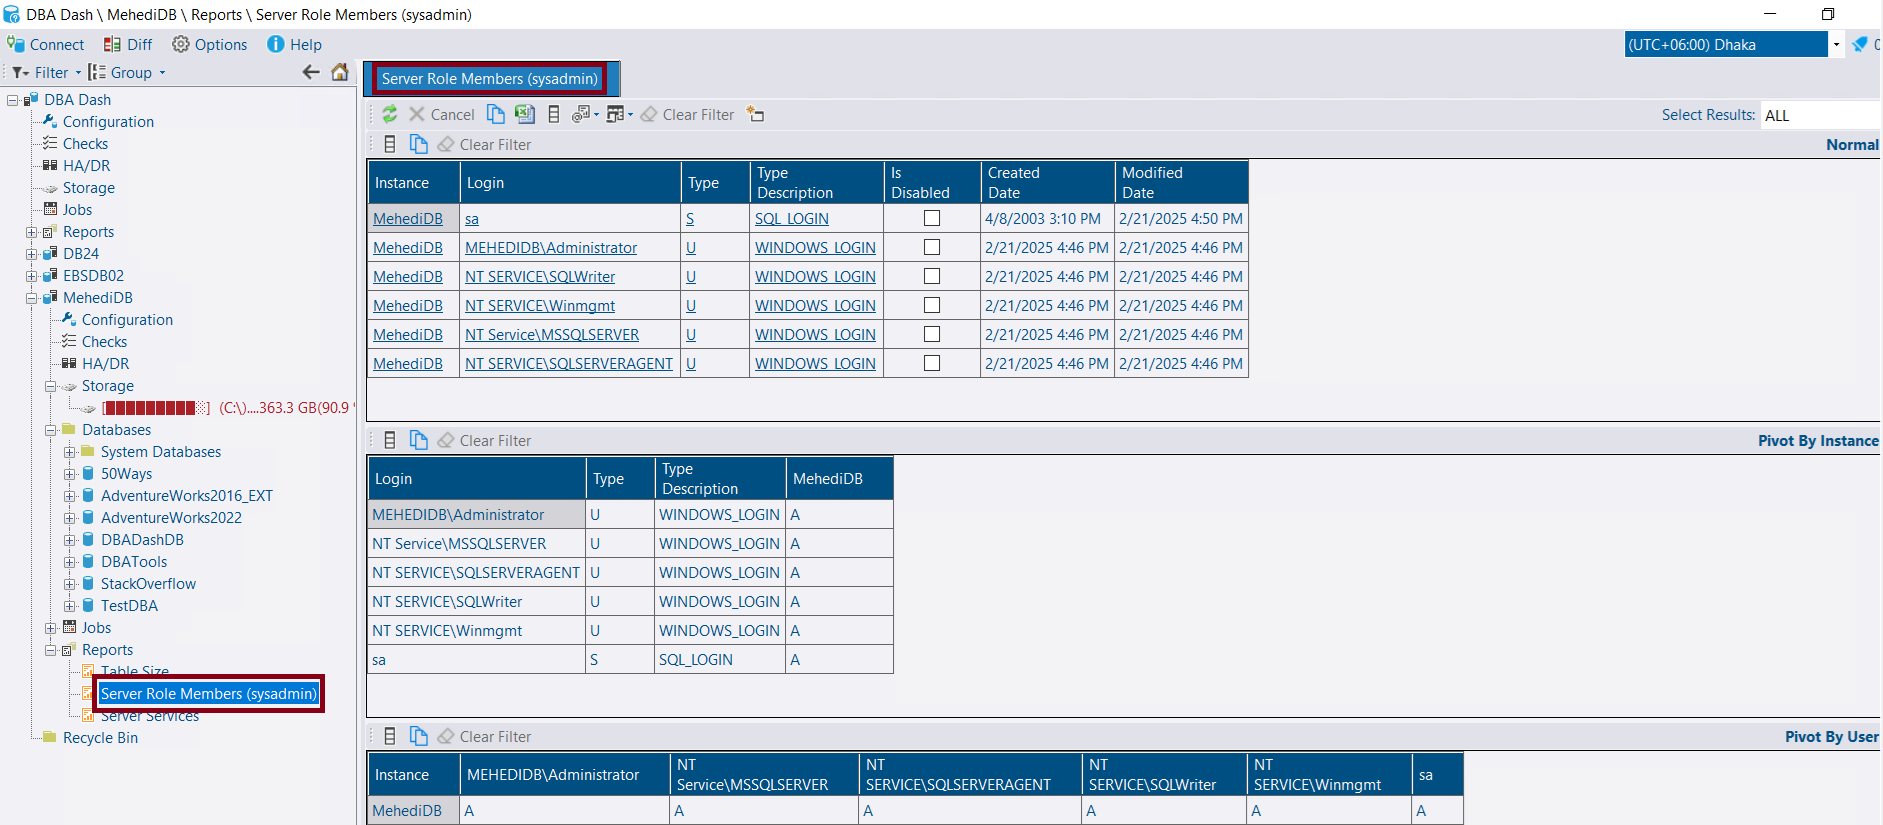
Figure-21: Server Role Members monitoring
Apart from this you can track down DB Schema changes, monitor custom counter, running community scripts like First Responder Kit and generate customized reports.
Benefits of DBA Dash
DBA Dash has many folds benefits:
- Comprehensive monitoring of multiple node at a time
- Easy troubleshooting by going any point of time and find out what happened at that time
- Measuring effectiveness of any query tuning or index optimization
- Creating performance baseline of your workload and define the "normal"
- Proactively monitor any performance regression
- Gives alert for any critical incident
- Customized counter tracking and reporting
- All these features are free and opensource
Limitations
While DBA Dash is a powerful and free SQL Server monitoring tool, like any tool, it has some limitations you should be aware of. Here are a few:
- No API or third party integration support.
- Only support SQL Server Database. No MySql, PostGres SQL or Oracle.
- Requires Self-Hosting and Maintenance. No cloud or SaaS based monitoring tool.
- User Community is smaller.
Final Words
DBA Dash stands out as a powerful, free solution for SQL Server monitoring, offering deep insights into server performance, health, and issues—all without licensing costs. Whether you are managing a handful of servers or a large environment, it equips DBAs with the visibility they need to proactively address problems and optimize their systems. As you explore DBA Dash in your own environment, you will likely discover even more ways it can simplify your daily database management tasks. If you are seeking a reliable monitoring companion without breaking the budget, DBA Dash is definitely worth a closer look.
References
Going Further
If SQL Server is your thing and you enjoy learning real-world tips, tricks, and performance hacks—you are going to love my training sessions too!
Need results fast? I am also available for 1-on-1 consultancy to help you troubleshoot and fix your database performance issues.
Let’s make your SQL Server to take your business Challenge!
For any queries, mail to mamehedi.hasan[at]gmail.com.