Recently, we observed something unusual things in our system, like the database was up, but nothing was responding. New connections were hanging, queries were not progressing, and even basic monitoring tools were struggling to connect. Team puzzled by seeing no significant CPU and memory pressure. The obvious solution was "Just reboot it!". But this time, we hold our nerve and decided to investigate it further. As the delving down started, different issues popped up — blocking, slow queries, even network issues. But the real problem was something less visible and often overlooked, the THREADPOOL starvation.

Figure-1: THREADPOOL Exhaustion and THREADPOOL waits
Some Key Concepts
Thread
In SQL Server, a thread (or worker thread) is the unit that actually executes a request. When a client sends a query, SQL Server assigns the request to a worker thread, which performs all the work like reading data, executing logic, and returning results. These worker threads are managed internally by SQL Server and are mapped to schedulers (which are tied to CPU cores).
Thread Pool
The thread pool is the collection of all worker threads available to execute requests. When a query comes in, SQL Server assigns it to a worker thread from this pool. These threads are reused. The size of the thread pool is limited based on system configuration and hardware capacity.
Thread Pool Wait
This occurs when there are no free threads available in SQL Server’s thread pool. So, a task or request is waiting for an available thread in the thread pool to execute. Resulting delay queries execution or login attempts failure.
Thread Exhaustion
Worker thread exhaustion typically occurs when high number of concurrent queries or long-running queries consume almost all available threads.
MAX Worker Thread Count
Number of worker threads are finite. You can check it using Query Snippet-1. SQL Server uses a formula to calculate it.
| No. of Processors |
No. of Worker Threads |
| <= 4 |
512 |
| > 4 and <= 64 |
512 + (Logical CPUs - 4)*16. e.g. For 8 Core system, 512 + (8-4)*16 = 576 |
Table-1: Worker threads calculation formula
SELECT max_workers_count FROM sys.dm_os_sys_info

-- Query Snippet-1
OS Thread Count
OS threads of your SQL Server instance or thread pool. You can check it using Query Snippet-2. Remember this thread count may exceeds the max_workers_count, as SQL Server uses many other threads for its own operations. However, at some point it will hit the ceiling and this count will not increase.
SELECT COUNT(*) FROM sys.dm_os_threads

-- Query Snippet-2
Overriding MAX Worker Thread Count
You can override the default max_workers_count though it is not recommended. Before doing any modification, make sure you are convinced why you are doing it. Use Query Snippet-3 to update the max_workers_count settings.
  -- Enable advanced options
EXEC sp_configure 'show advanced options', 1;
RECONFIGURE;

-- Set max worker threads (example: 512). NOT RECOMMENDED
EXEC sp_configure 'max worker threads', 512;
RECONFIGURE;

-- Query Snippet-3
THREADPOOL Exhaustion Simulation
For simulation purpose, we will use the simple locking-blocking technique, which will exhaust all the available threads. For this testing, let's create a table and follow below steps:
-- Create a table for simulation
CREATE TABLE [dbo].[Test](
	[pk_id] [int] IDENTITY(1,1) NOT NULL PRIMARY KEY,
	[name] [varchar](50) NOT NULL,
)
GO

-- Insert a dummy row
INSERT INTO [Test] ([name]) VALUES('MEHEDI')
GO

-- Open and hold the transaction. Donot commit it
BEGIN TRAN
UPDATE [Test] WITH (TABLOCKX)
	SET [name] = 'Mehedi Hasan'
-- COMMIT

-- Query Snippet-4
Now paste the Query Snippet-4 to your SQLQueryStress and run the stress testing as shown in the Figure-2. You will see that after a few moments, total exceptions reached to a threshold value (in this case 79) and there is no progress in iterations completed. If you click on the "..." of "Total Exceptions", you will see error message like max pool size reached Figure-3.

Figure-2: Putting stress using SQLQueryStress
This error surfaced, as SQL Server already allocated available threads to the existing queries and there is no thread left for the new connections.

Figure-3: Exception in SQLQueryStress
THREADPOOL Exhaustion Detection
Try to open a new query window in SSMS. It has high chance that the new window will be hanged as SQL Server already allocated the all available threads! The only lifeline is Dedicated Administrator Connection (DAC). Now in DAC mode, run the Query Snippet-5 to check the THREADPOOL waits as shown in Figure-4.
SELECT *
FROM sys.dm_os_waiting_tasks
WHERE wait_type = 'THREADPOOL'

-- Query Snippet-5

Figure-4: THREADPOOL wait type detection
If you run sp_WhoIsActive (Query Snippet-6) with some options, you can see that all queries are in suspended mode for a particular session id (in this case 95) and 95 emerged from our Query Snippet-4 which is the leader of blocking.
sp_whoisactive
@get_locks = 1
,@find_block_leaders = 1
,@sort_order = '[blocked_session_count] DESC'

-- Query Snippet-6
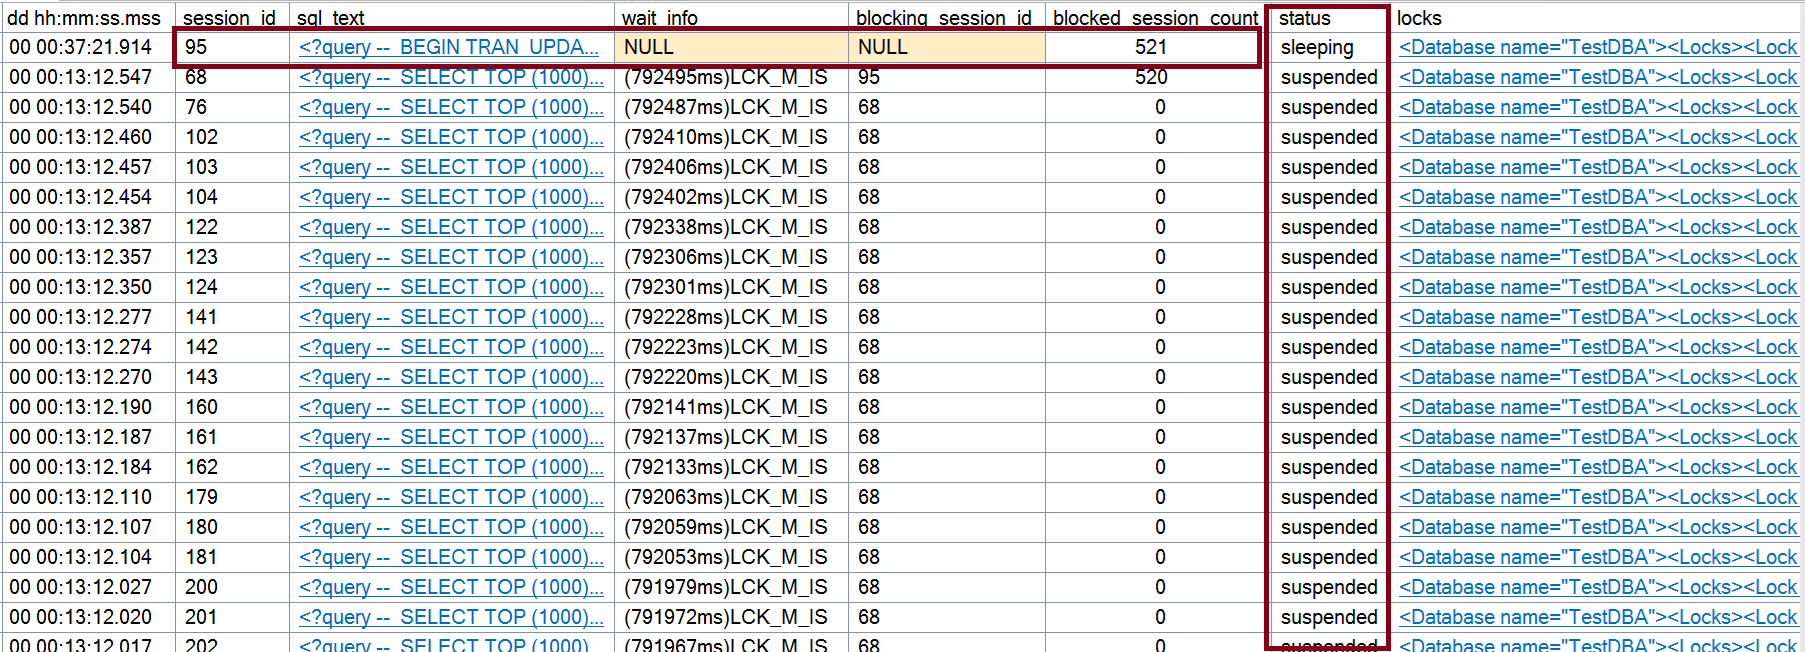
Figure-5: Output of sp_WhoIsActive
Common Reasons
- Massive Blocking: This is the common culprit. In our above example, a single query holds a lock on a table, and hundreds of other queries line up behind it. Each waiting query still occupies a worker thread, eventually exhausts the entire thread pool.
- Parallelism: A query with a high MAXDOP (Max Degree of Parallelism) can grab dozens of threads at once. If many users run parallel queries simultaneously, they can eat the entire thread pool in seconds.
- Slow I/O or Heavy Load: If your storage is slow, threads stay "in-flight" for much longer. If new requests come in faster than old ones finish, the pool hits its limit.
- Zombie Transactions: Connections that stay open but "idle" while holding locks can prevent threads from being released.
Common Symptoms
As you experienced in the above simulation, common symptoms are:
- Login Failures: You will get errors saying error message like max pool size reached.
- Wait Type THREADPOOL: High values for this wait type in your monitoring tools.
- Unresponsive SSMS: If you try to open a new query window, it will just spin forever.
Common Fix and Prevention
- Find the Leader of Blocking: As discussed in above section, run sp_WhoIsActive to find out the leader of the blocking and take appropriate actions.
- Tune MAXDOP Settings: Adjust your MAXDOP based on the best practices.
- Avoid "Max Worker Threads" Tweaks: It is tempting to just increase the thread limit in sp_configure. However, this is usually a band-aid. More threads mean more memory overhead (roughly 2MB per thread) and more context switching, which can actually slow the server down further.
- Optimize Queries: The faster a query finishes, the sooner its thread returns to the pool. Focus on high-frequency, long-running queries first.
Final Words
THREADPOOL exhaustion can make SQL Server appear online while the system becomes practically unresponsive. The real skill is identifying the warning signs early by monitoring worker usage, runnable queues, and wait types before complete starvation occurs. Tools like sp_WhoIsActive and DAC play a critical role in diagnosing these situations and restoring control. In most cases, THREADPOOL waits are not the root cause themselves, but the result of deeper issues such as blocking, excessive concurrency, or inefficient queries.
References
Going Further
If SQL Server is your thing and you enjoy learning real-world tips, tricks, and performance hacks—you are going to love my training sessions too!
Need results fast? I am also available for 1-on-1 consultancy to help you troubleshoot and fix your database performance issues.
Let’s make your SQL Server to take your business Challenge!
For any queries, mail to mamehedi.hasan[at]gmail.com.